 10
10peptides
spectra
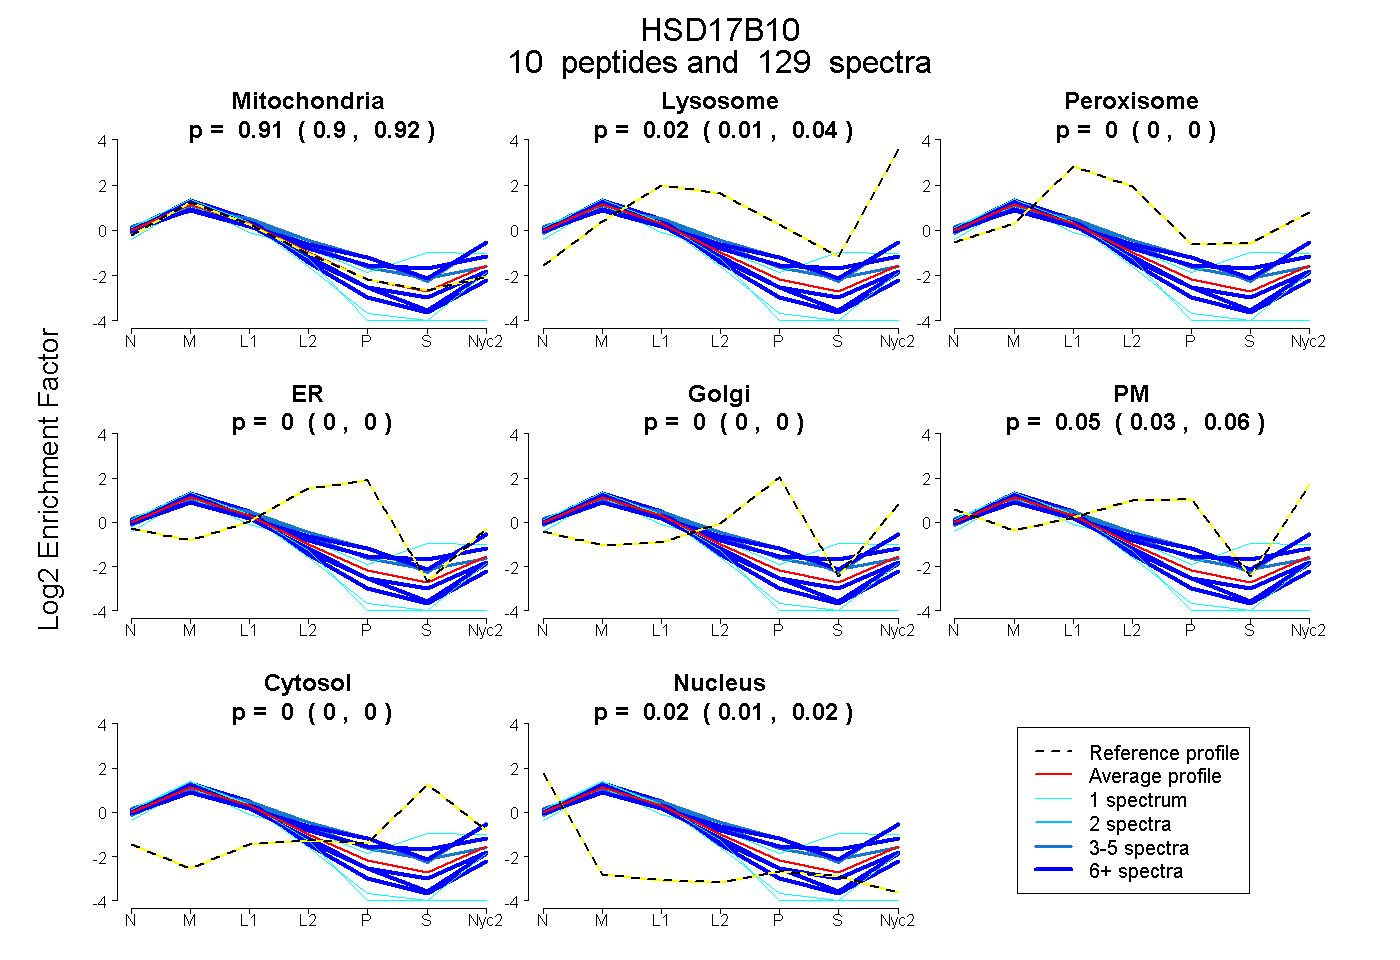
0.901 | 0.917
0.009 | 0.036
0.000 | 0.000
0.000 | 0.000
0.000 | 0.000
0.032 | 0.063
0.000 | 0.000
0.011 | 0.023
11peptides
spectra
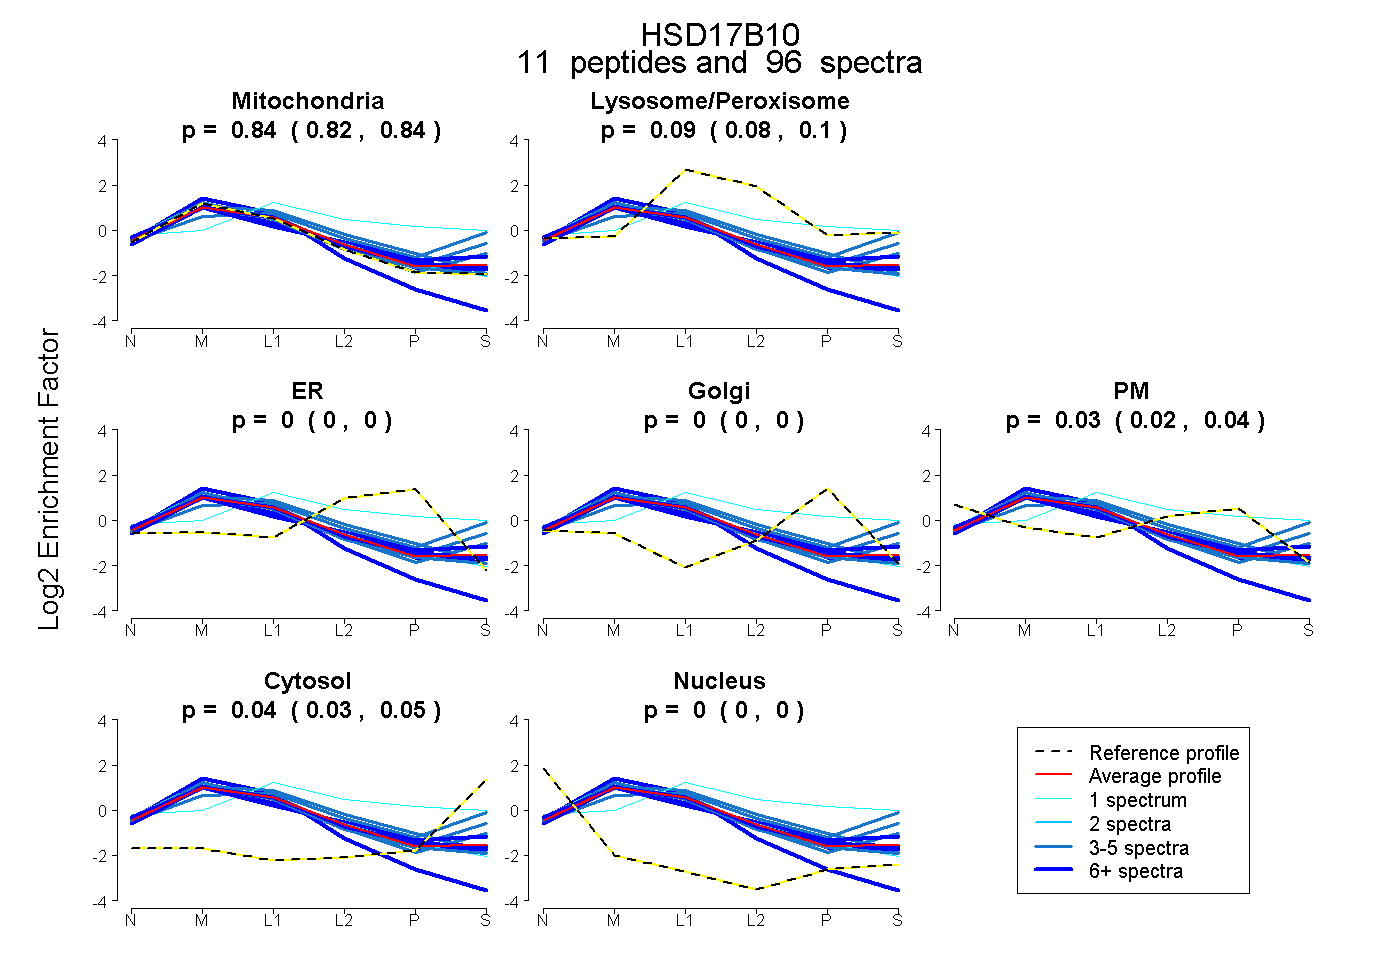
0.824 | 0.845
0.084 | 0.100
0.000 | 0.000
0.000 | 0.000
0.019 | 0.039
0.033 | 0.049
0.000 | 0.000
13peptides
spectra
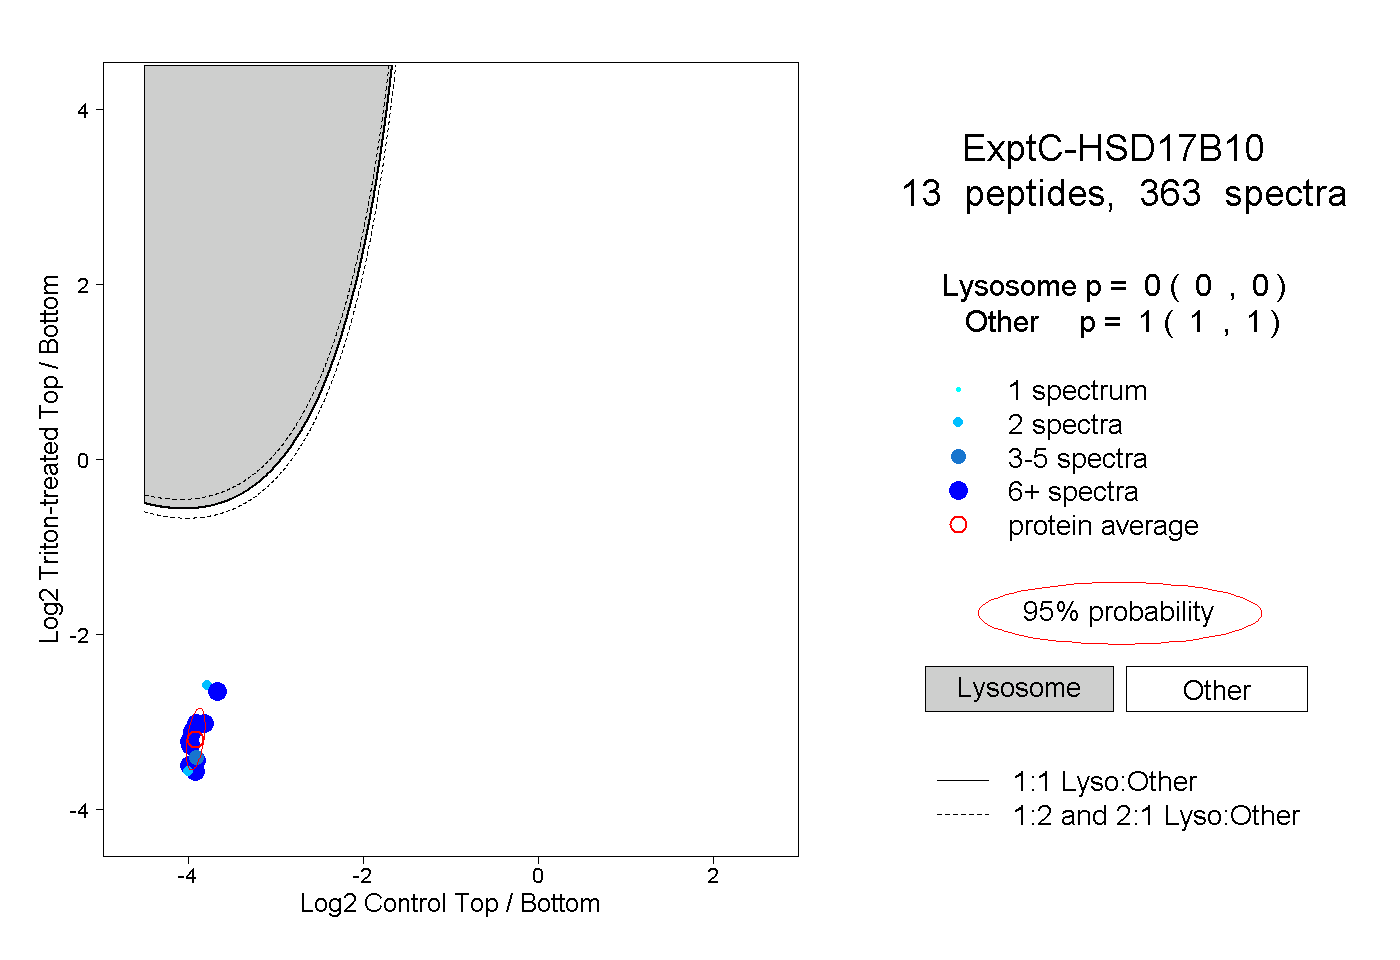
0.000 | 0.000
1.000 | 1.000
5peptides
spectra
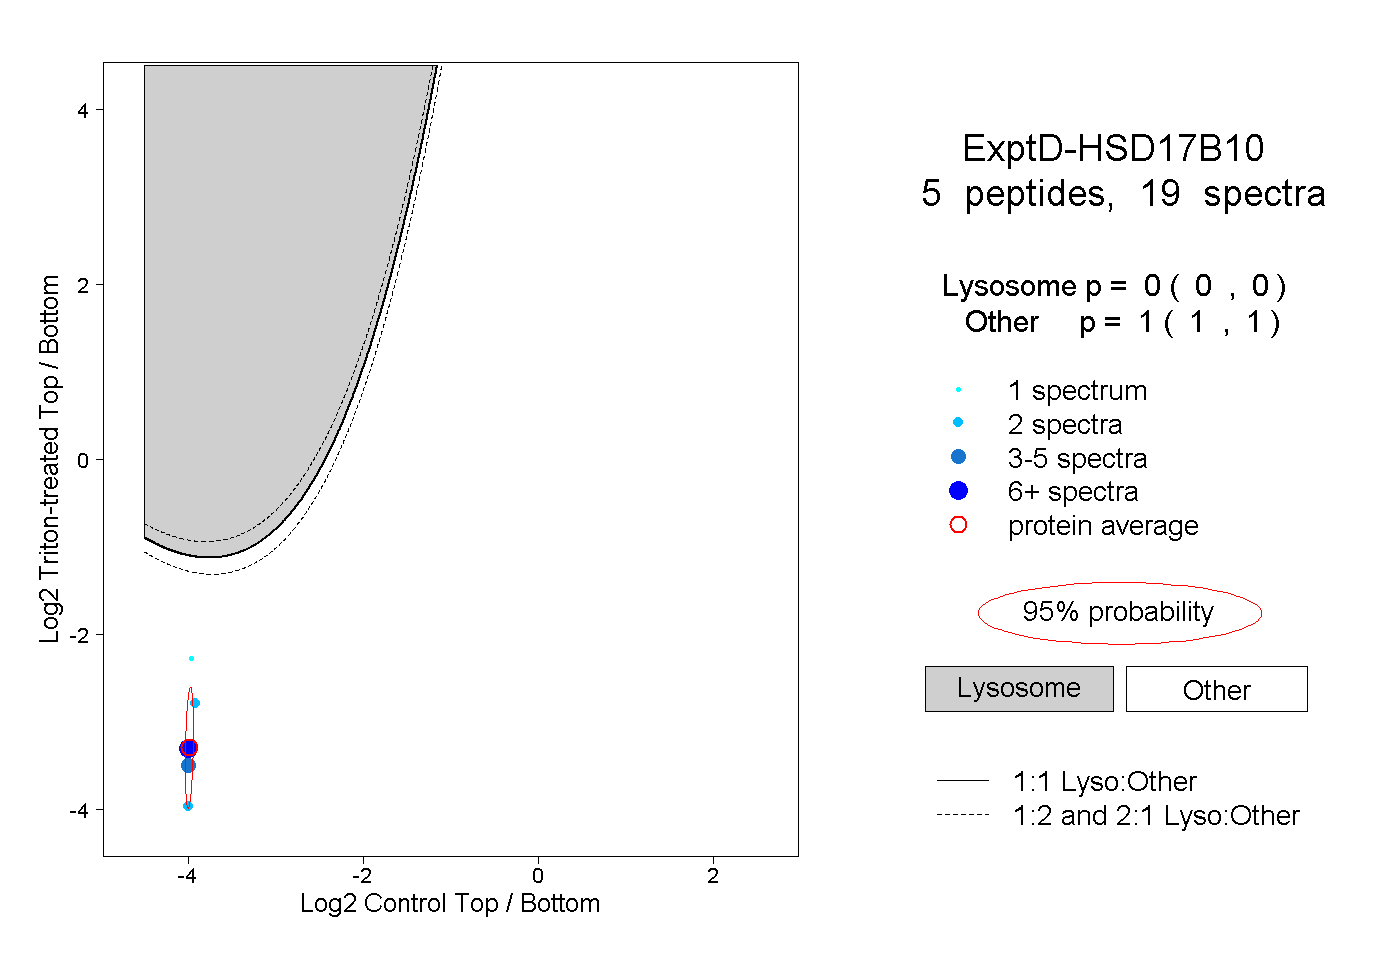
0.000 | 0.000
1.000 | 1.000