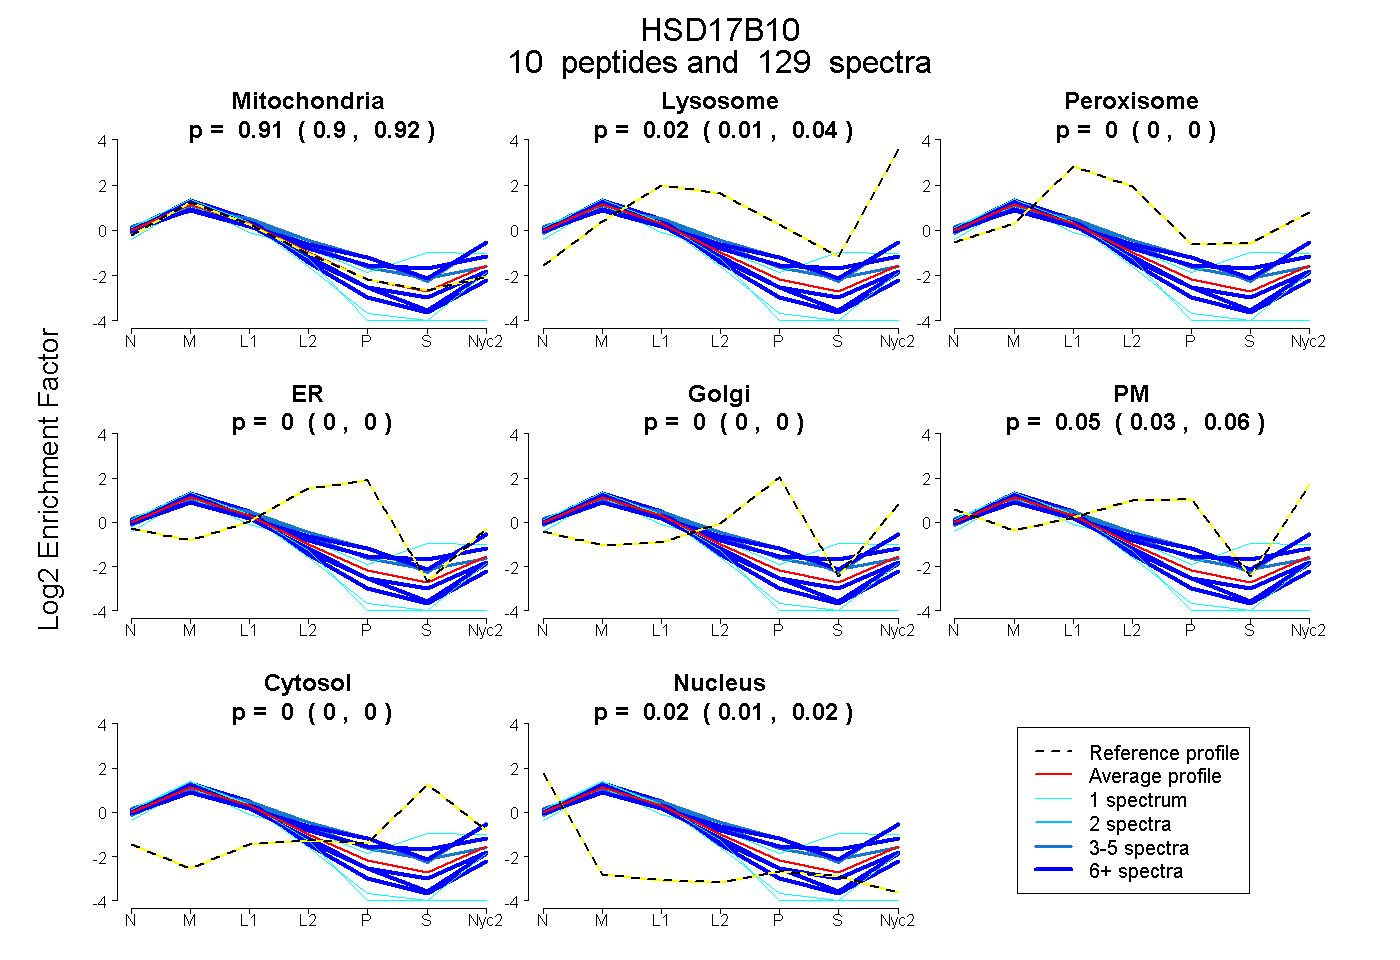
| 10 spectra, GGIVGMTLPIAR |
0.859 |
|
0.019 |
|
0.000 |
0.000 |
0.098 |
0.024 |
0.000 |
|
| 1 spectrum, LVGQGATAVLLDVPNSEGETEAK |
0.873 |
|
0.018 |
|
0.000 |
0.000 |
0.109 |
0.000 |
0.000 |
|
| 1 spectrum, GVIINTASVAAFEGQVGQAAYSASK |
0.053 |
|
0.637 |
|
0.000 |
0.196 |
0.014 |
0.101 |
0.000 |
|
| 18 spectra, DLAPIGIR |
0.962 |
|
0.000 |
|
0.000 |
0.000 |
0.000 |
0.000 |
0.038 |
|
| 3 spectra, IDVAVNCAGIAVAIK |
0.780 |
|
0.115 |
|
0.000 |
0.000 |
0.000 |
0.104 |
0.000 |
|
| 3 spectra, LGGNCIFAPANVTSEK |
0.457 |
|
0.333 |
|
0.000 |
0.000 |
0.000 |
0.210 |
0.000 |
|
| 17 spectra, NQVHTLEDFQR |
0.829 |
|
0.064 |
|
0.000 |
0.000 |
0.088 |
0.019 |
0.000 |
|
| 4 spectra, GLVAVITGGASGLGLSTAK |
0.678 |
|
0.151 |
|
0.000 |
0.000 |
0.000 |
0.170 |
0.000 |
|
| 4 spectra, NFLASQVPFPSR |
0.951 |
|
0.000 |
|
0.000 |
0.019 |
0.030 |
0.000 |
0.000 |
|
| 30 spectra, LVAGVMGQNEPDQGGQR |
0.715 |
|
0.117 |
|
0.000 |
0.074 |
0.000 |
0.094 |
0.000 |
|
| 5 spectra, EVQAALTLAK |
0.730 |
|
0.147 |
|
0.123 |
0.000 |
0.000 |
0.000 |
0.000 |
|
 10
10