 10
10peptides
spectra
0.901 | 0.917
0.009 | 0.036
0.000 | 0.000
0.000 | 0.000
0.000 | 0.000
0.032 | 0.063
0.000 | 0.000
0.011 | 0.023
| Plot | Mito | Lyso | Perox | ER | Golgi | PM | Cytosol | Nucleus | |||||
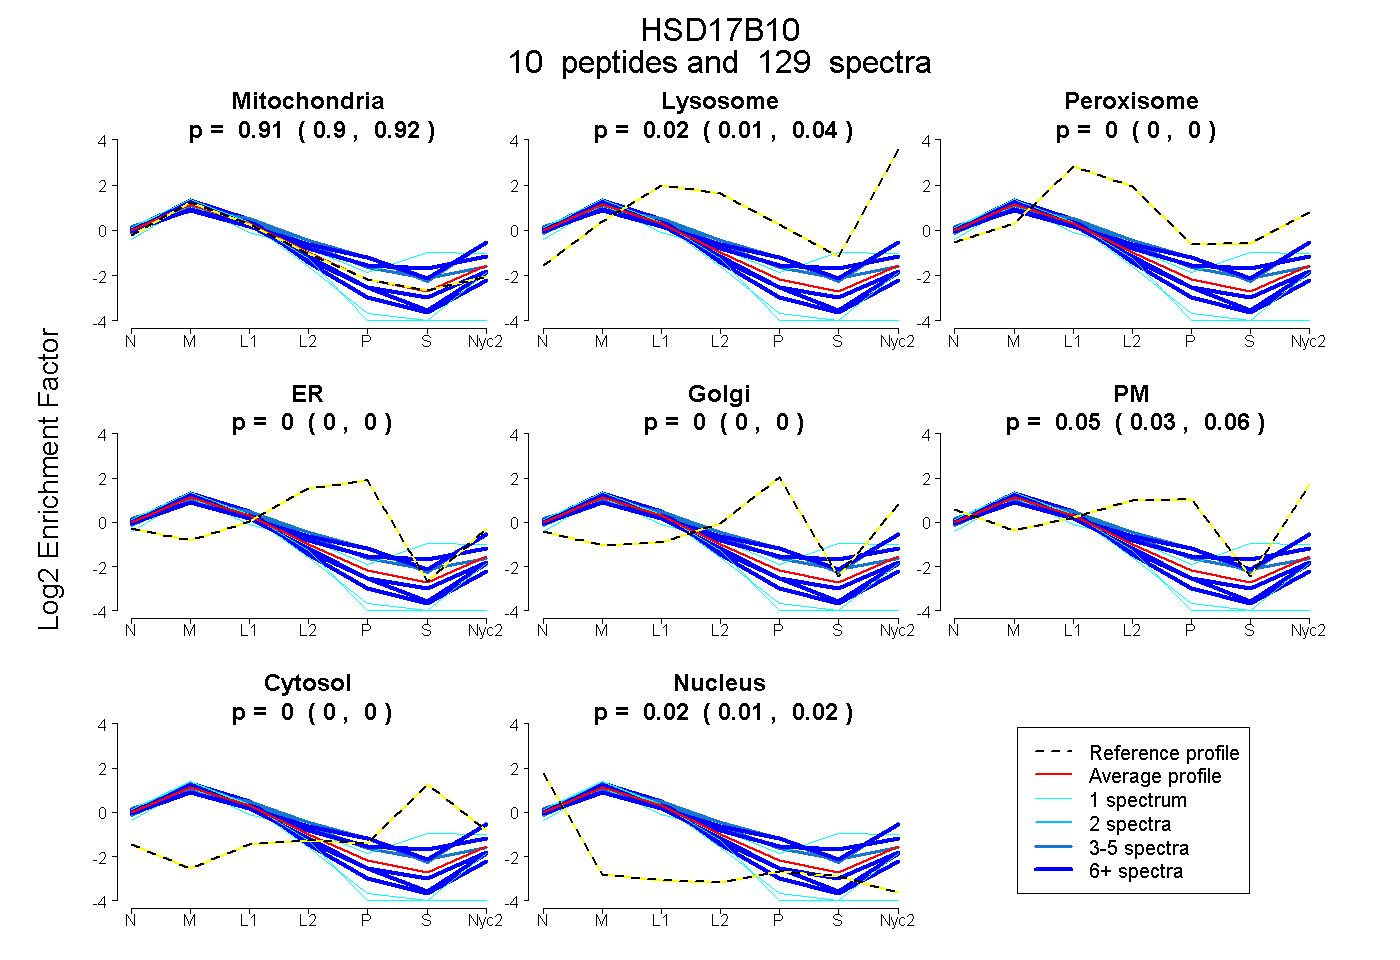
| Expt A |
10 peptides |
129 spectra |
|
0.910 0.901 | 0.917 |
0.023 0.009 | 0.036 |
0.000 0.000 | 0.000 |
0.000 0.000 | 0.000 |
0.000 0.000 | 0.000 |
0.050 0.032 | 0.063 |
0.000 0.000 | 0.000 |
0.018 0.011 | 0.023 |
| 62 spectra, GGIVGMTLPIAR | 0.966 | 0.000 | 0.000 | 0.000 | 0.000 | 0.000 | 0.000 | 0.034 | ||
| 15 spectra, DLAPIGIR | 0.975 | 0.000 | 0.000 | 0.000 | 0.000 | 0.000 | 0.000 | 0.025 | ||
| 1 spectrum, IDVAVNCAGIAVAIK | 0.862 | 0.000 | 0.000 | 0.000 | 0.000 | 0.000 | 0.000 | 0.138 | ||
| 1 spectrum, LGGNCIFAPANVTSEK | 0.669 | 0.100 | 0.026 | 0.000 | 0.000 | 0.000 | 0.205 | 0.000 | ||
| 1 spectrum, VVTIAPGLFATPLLTTLPDK | 0.964 | 0.000 | 0.000 | 0.000 | 0.000 | 0.000 | 0.000 | 0.036 | ||
| 12 spectra, NQVHTLEDFQR | 0.647 | 0.055 | 0.000 | 0.000 | 0.000 | 0.251 | 0.047 | 0.000 | ||
| 4 spectra, GLVAVITGGASGLGLSTAK | 0.649 | 0.053 | 0.041 | 0.000 | 0.000 | 0.257 | 0.000 | 0.000 | ||
| 10 spectra, NFLASQVPFPSR | 0.980 | 0.000 | 0.000 | 0.000 | 0.000 | 0.000 | 0.000 | 0.020 | ||
| 20 spectra, LVAGVMGQNEPDQGGQR | 0.702 | 0.010 | 0.068 | 0.000 | 0.000 | 0.105 | 0.115 | 0.000 | ||
| 3 spectra, EVQAALTLAK | 0.805 | 0.000 | 0.113 | 0.019 | 0.018 | 0.018 | 0.027 | 0.000 |
| Plot | Mito | Lyso or Perox | ER | Golgi | PM | Cytosol | Nucleus | ||||||
| Expt B |
11 peptides |
96 spectra |
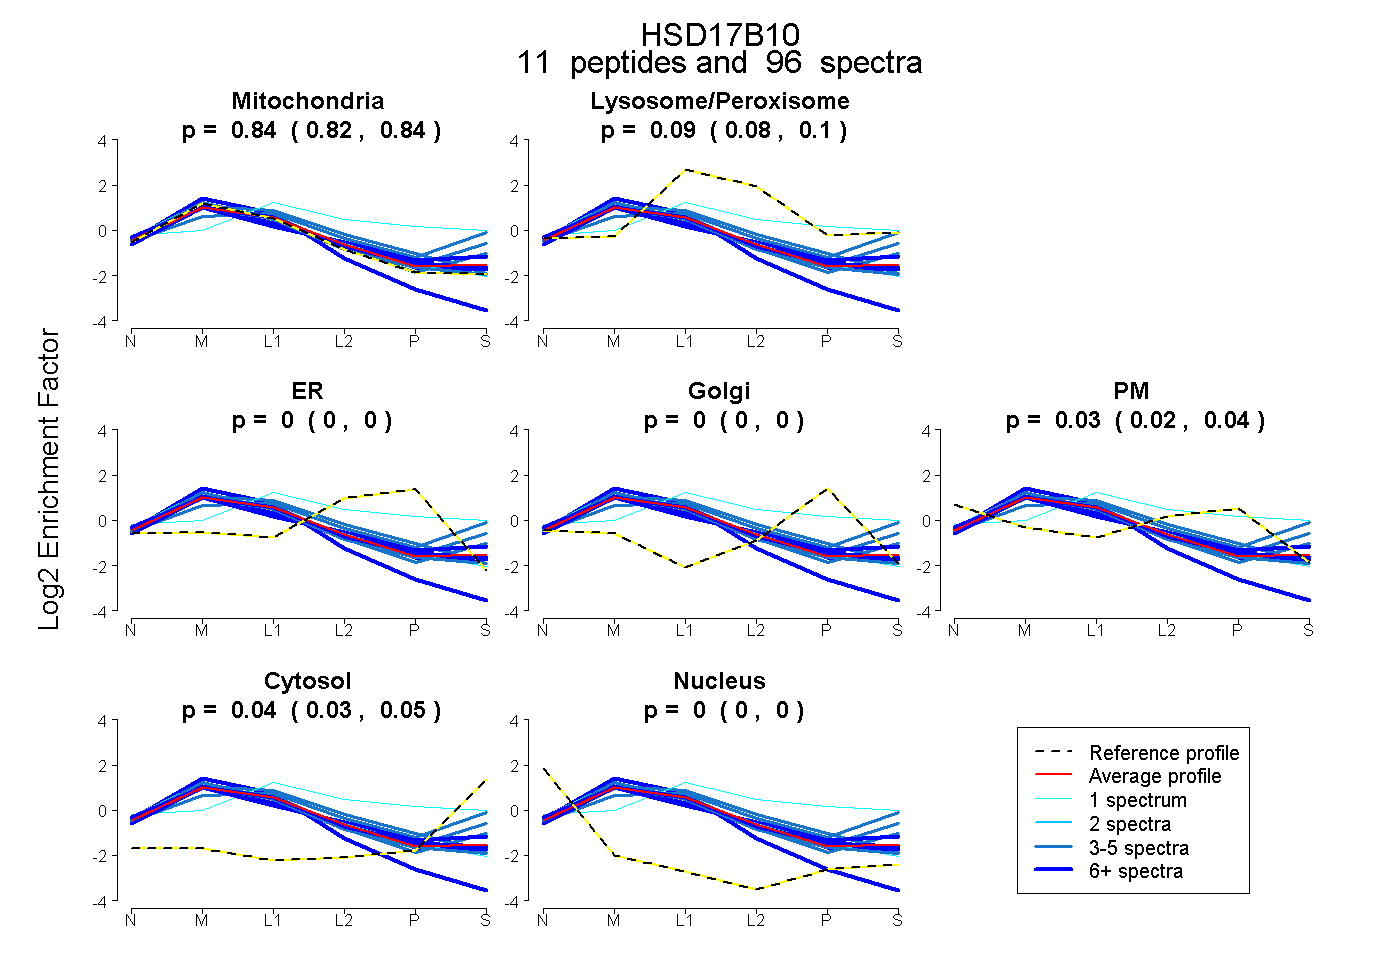 |
0.836 0.824 | 0.845 |
0.092 0.084 | 0.100 |
0.000 0.000 | 0.000 |
0.000 0.000 | 0.000 |
0.031 0.019 | 0.039 |
0.042 0.033 | 0.049 |
0.000 0.000 | 0.000 |
|||
| Plot | Lyso | Other | |||||||||||
| Expt C |
13 peptides |
363 spectra |
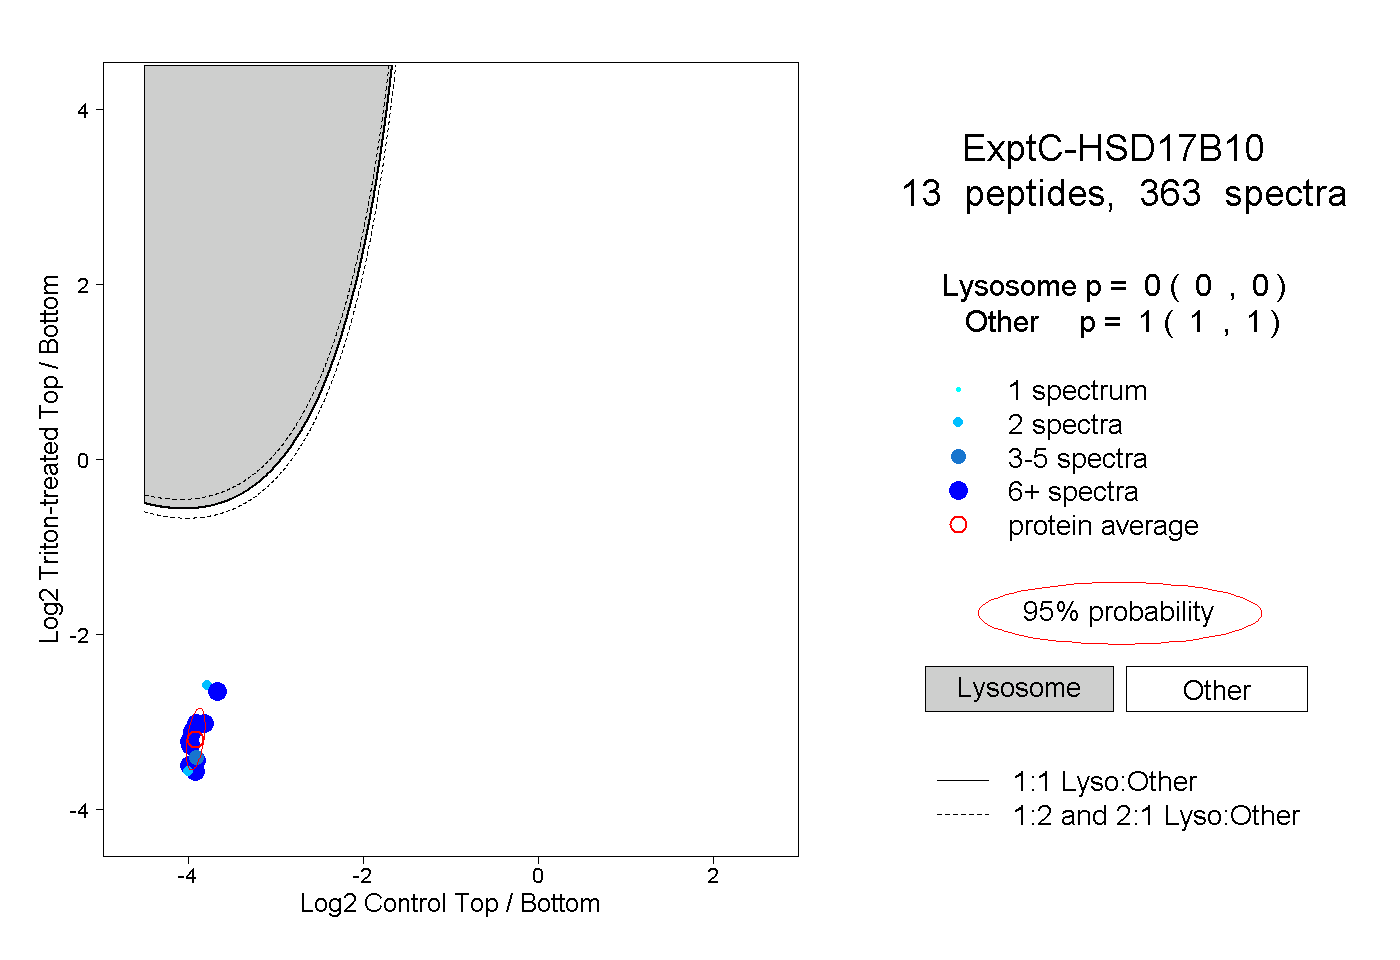 |
0.000 0.000 | 0.000 |
1.000 1.000 | 1.000 |
||||||||
| Plot | Lyso | Other | |||||||||||
| Expt D |
5 peptides |
19 spectra |
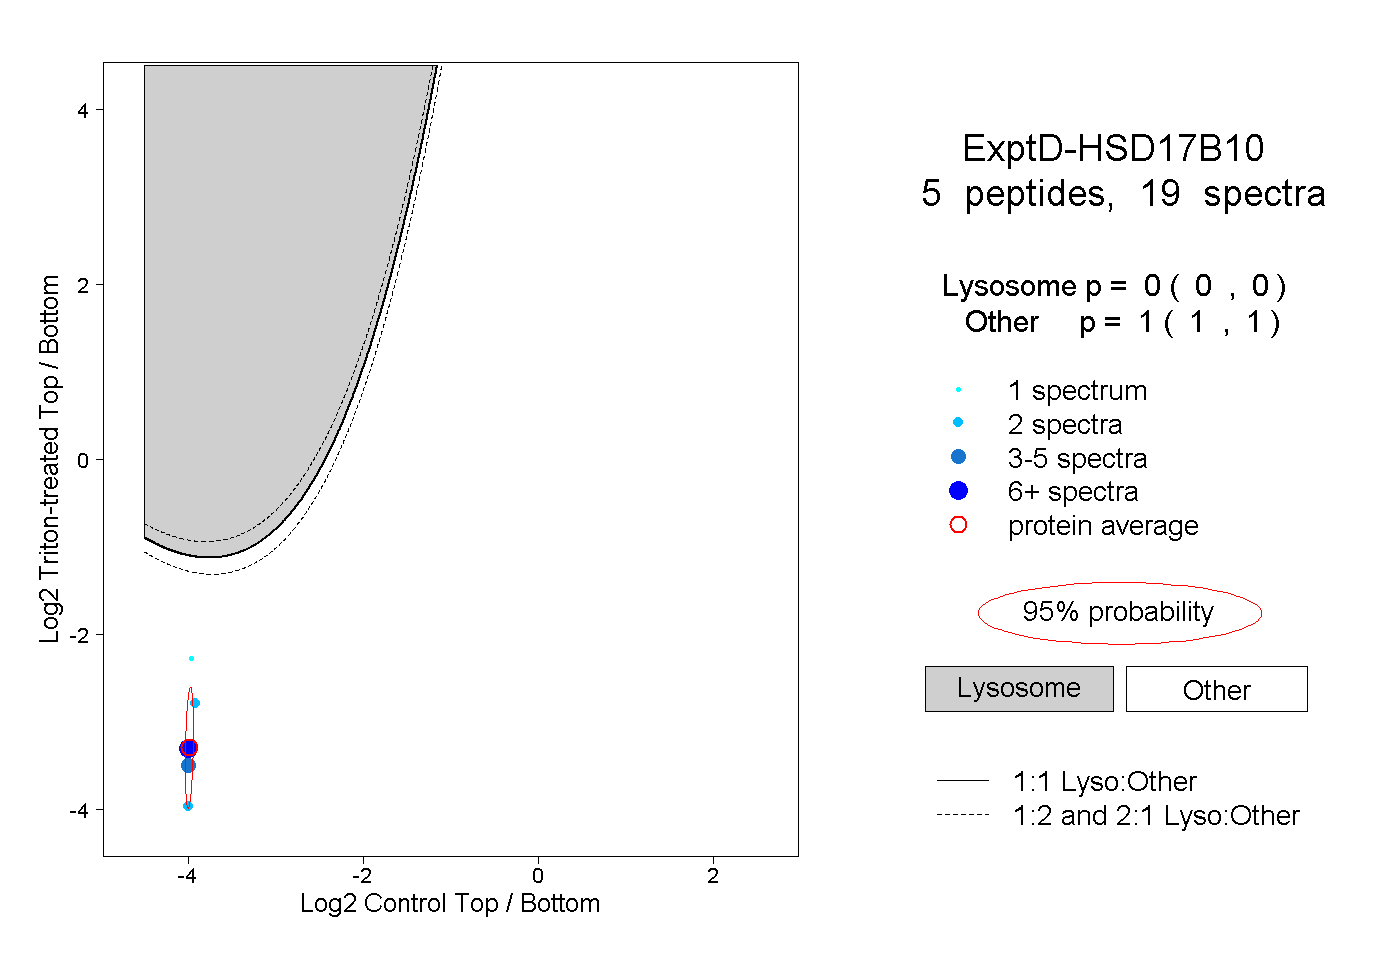 |
0.000 0.000 | 0.000 |
1.000 1.000 | 1.000 |