 13
13peptides
spectra

0.000 | 0.000
0.313 | 0.351
0.645 | 0.683
0.000 | 0.000
0.000 | 0.000
0.000 | 0.000
0.000 | 0.000
0.000 | 0.000
6peptides
spectra

0.000 | 0.000
0.844 | 0.910
0.000 | 0.044
0.000 | 0.000
0.073 | 0.139
0.000 | 0.000
0.000 | 0.000
23peptides
spectra
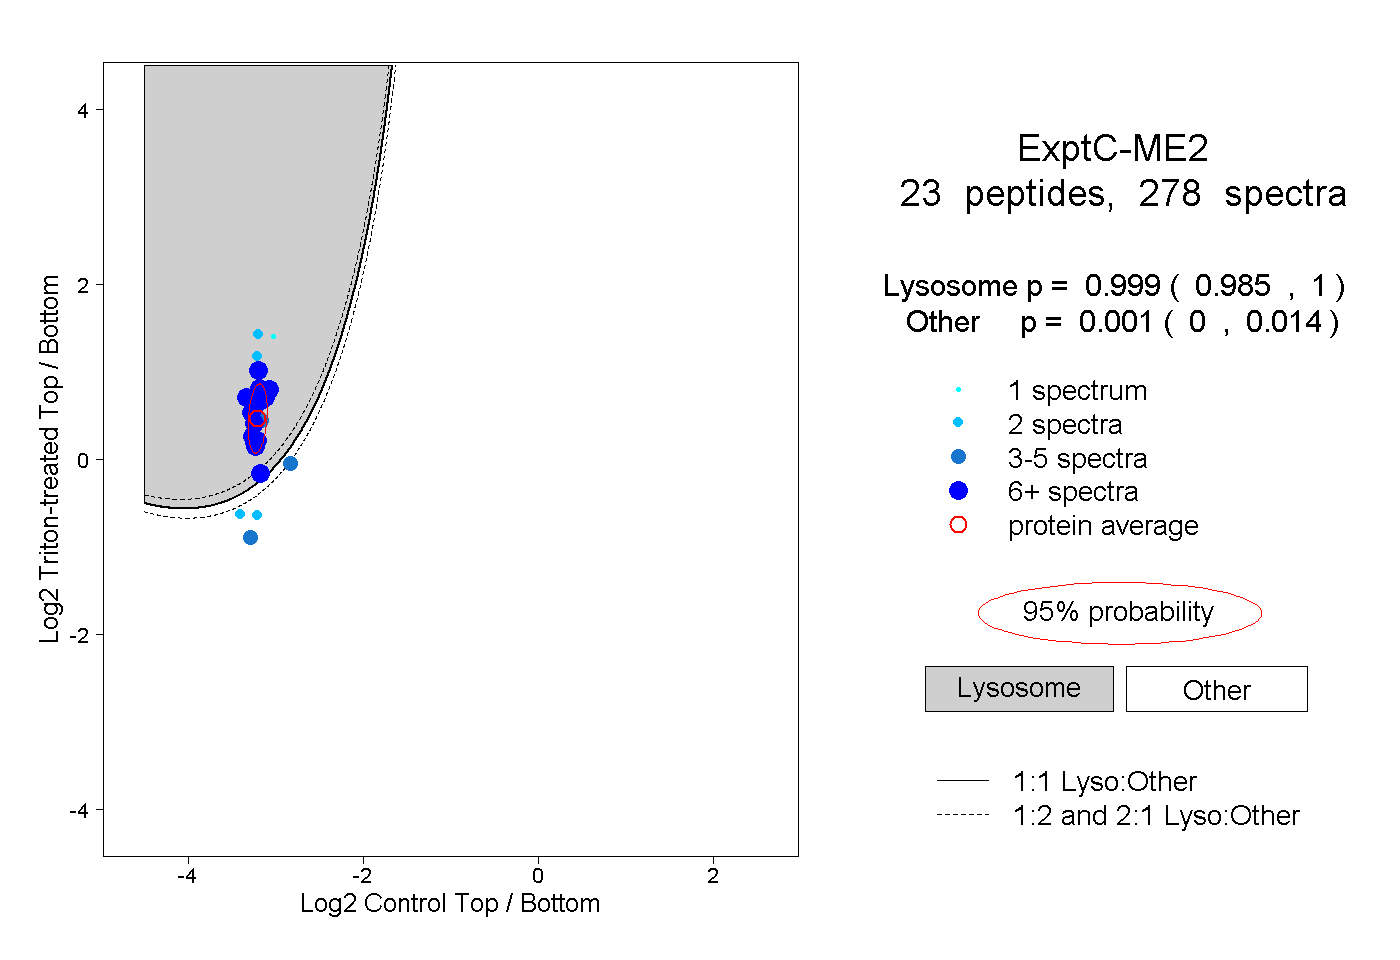
0.985 | 1.000
0.000 | 0.014
9peptides
spectra
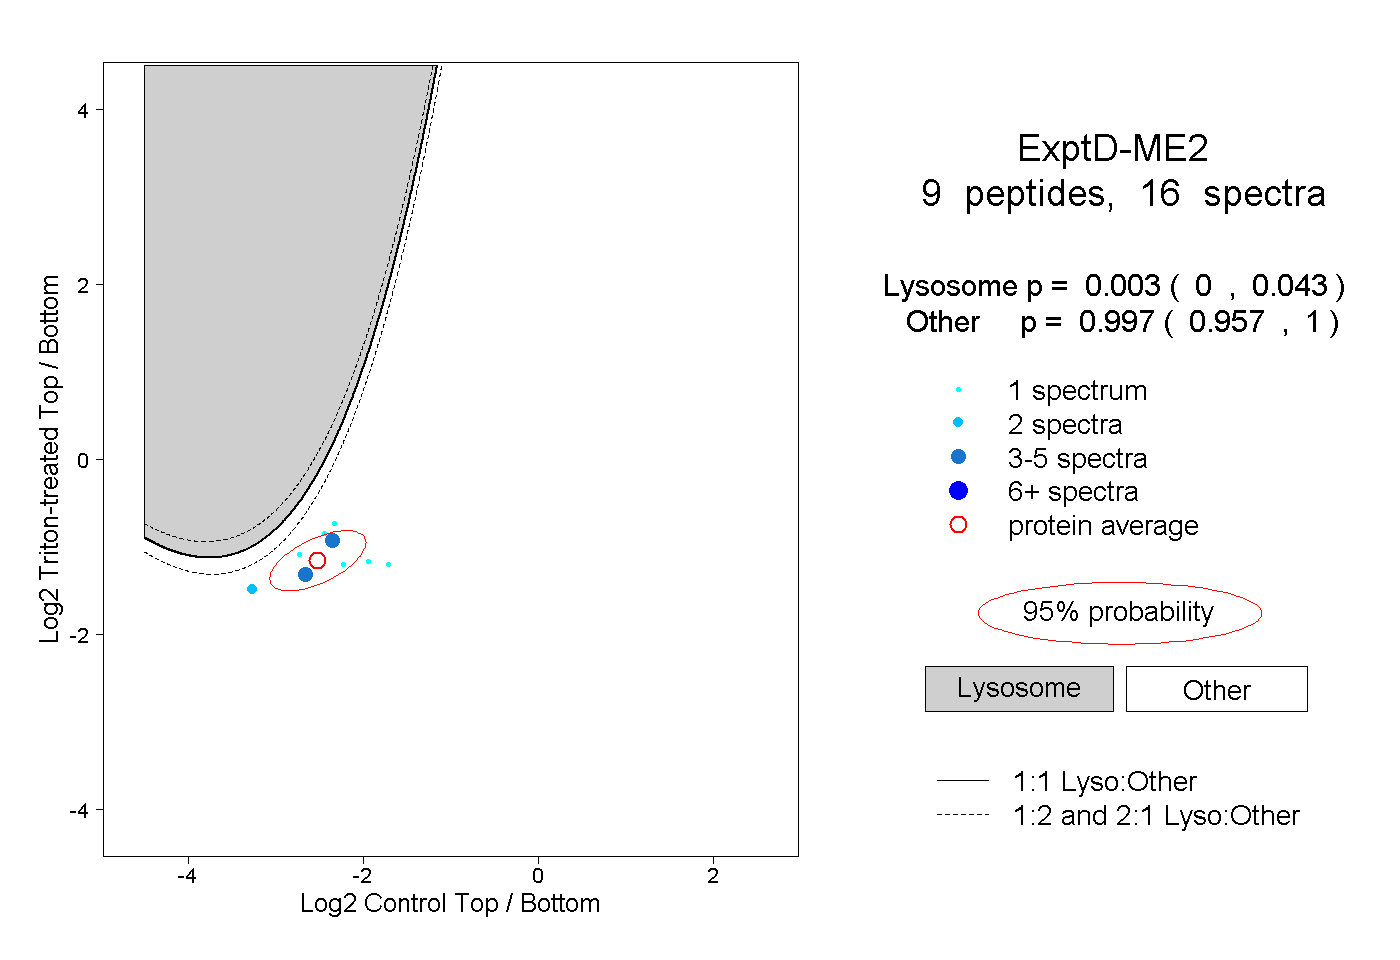
0.000 | 0.043
0.957 | 1.000