 13
13peptides
spectra

0.000 | 0.000
0.313 | 0.351
0.645 | 0.683
0.000 | 0.000
0.000 | 0.000
0.000 | 0.000
0.000 | 0.000
0.000 | 0.000
| Plot | Mito | Lyso | Perox | ER | Golgi | PM | Cytosol | Nucleus | |||||
| Expt A |
13 peptides |
27 spectra |
|
0.000 0.000 | 0.000 |
0.334 0.313 | 0.351 |
0.666 0.645 | 0.683 |
0.000 0.000 | 0.000 |
0.000 0.000 | 0.000 |
0.000 0.000 | 0.000 |
0.000 0.000 | 0.000 |
0.000 0.000 | 0.000 |
| 1 spectrum, LIVISMMESGLSEEEAQR | 0.000 | 0.387 | 0.613 | 0.000 | 0.000 | 0.000 | 0.000 | 0.000 | ||
| 3 spectra, ALTSQLTDEELAQGR | 0.000 | 0.124 | 0.693 | 0.000 | 0.000 | 0.183 | 0.000 | 0.000 | ||
| 2 spectra, GMAFTLQER | 0.000 | 0.366 | 0.634 | 0.000 | 0.000 | 0.000 | 0.000 | 0.000 | ||
| 2 spectra, AVVVTDGER | 0.000 | 0.190 | 0.810 | 0.000 | 0.000 | 0.000 | 0.000 | 0.000 | ||
| 4 spectra, GLFISISDR | 0.000 | 0.279 | 0.721 | 0.000 | 0.000 | 0.000 | 0.000 | 0.000 | ||
| 1 spectrum, ILFLGAGEAALGIAK | 0.000 | 0.715 | 0.285 | 0.000 | 0.000 | 0.000 | 0.000 | 0.000 | ||
| 2 spectra, SQLYDDLMDEFMK | 0.000 | 0.506 | 0.494 | 0.000 | 0.000 | 0.000 | 0.000 | 0.000 | ||
| 3 spectra, CLFASGSPFEPVR | 0.000 | 0.307 | 0.693 | 0.000 | 0.000 | 0.000 | 0.000 | 0.000 | ||
| 1 spectrum, YIYIMGIQER | 0.000 | 0.409 | 0.591 | 0.000 | 0.000 | 0.000 | 0.000 | 0.000 | ||
| 1 spectrum, LCLYTACAGIQPEK | 0.055 | 0.000 | 0.867 | 0.078 | 0.000 | 0.000 | 0.000 | 0.000 | ||
| 4 spectra, IETQDIQALR | 0.000 | 0.443 | 0.557 | 0.000 | 0.000 | 0.000 | 0.000 | 0.000 | ||
| 2 spectra, IAEYLYANK | 0.020 | 0.443 | 0.537 | 0.000 | 0.000 | 0.000 | 0.000 | 0.000 | ||
| 1 spectrum, SIVDNWPENHVK | 0.000 | 0.174 | 0.784 | 0.000 | 0.000 | 0.000 | 0.042 | 0.000 |
| Plot | Mito | Lyso or Perox | ER | Golgi | PM | Cytosol | Nucleus | ||||||
| Expt B |
6 peptides |
9 spectra |
 |
0.000 0.000 | 0.000 |
0.880 0.844 | 0.910 |
0.000 0.000 | 0.044 |
0.000 0.000 | 0.000 |
0.120 0.073 | 0.139 |
0.000 0.000 | 0.000 |
0.000 0.000 | 0.000 |
|||
| Plot | Lyso | Other | |||||||||||
| Expt C |
23 peptides |
278 spectra |
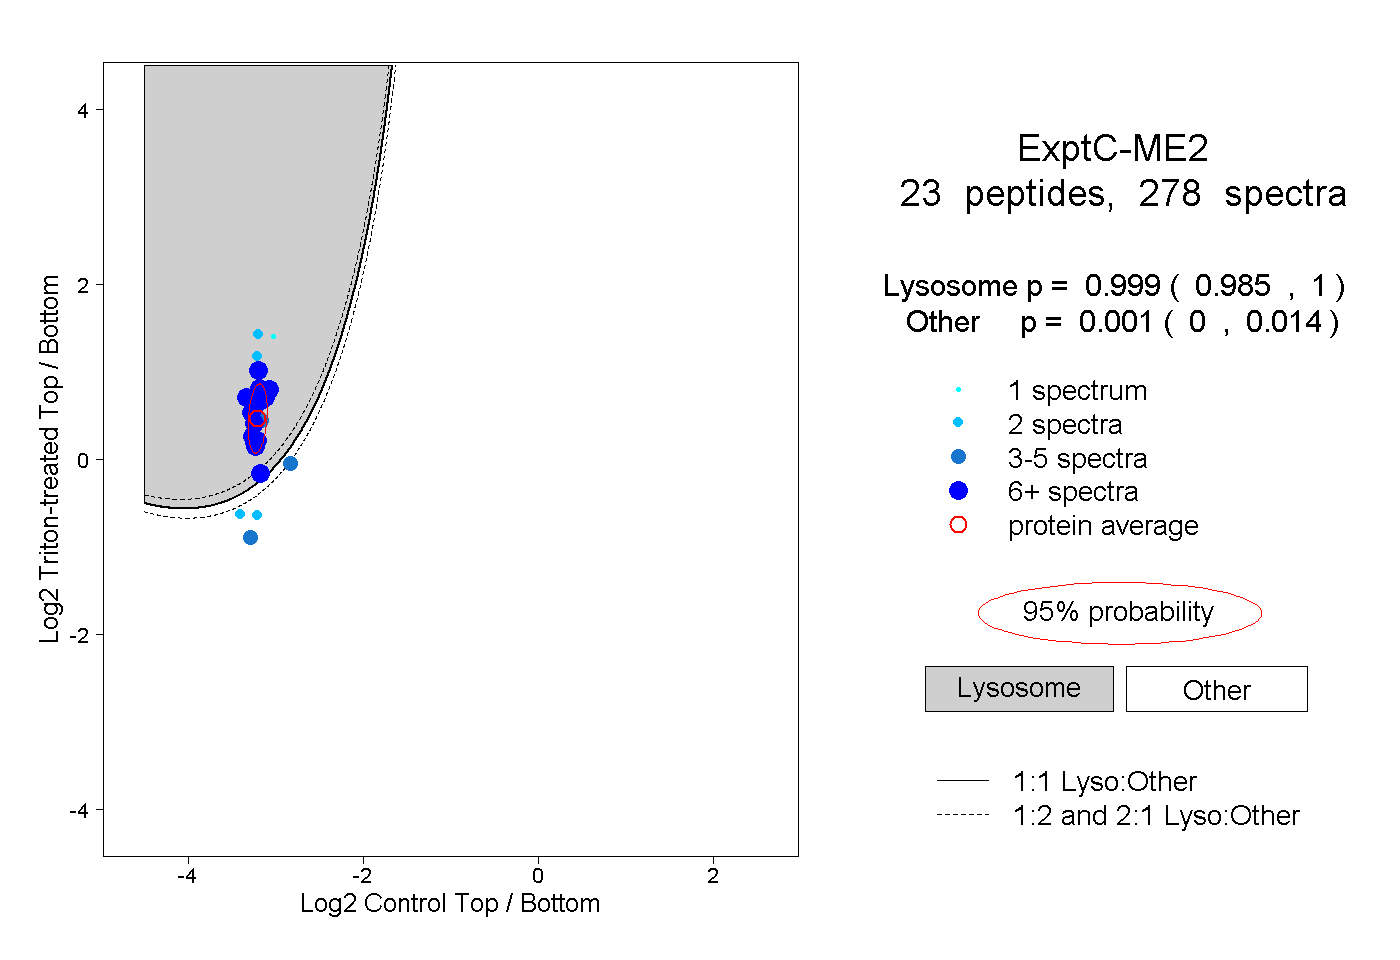 |
0.999 0.985 | 1.000 |
0.001 0.000 | 0.014 |
||||||||
| Plot | Lyso | Other | |||||||||||
| Expt D |
9 peptides |
16 spectra |
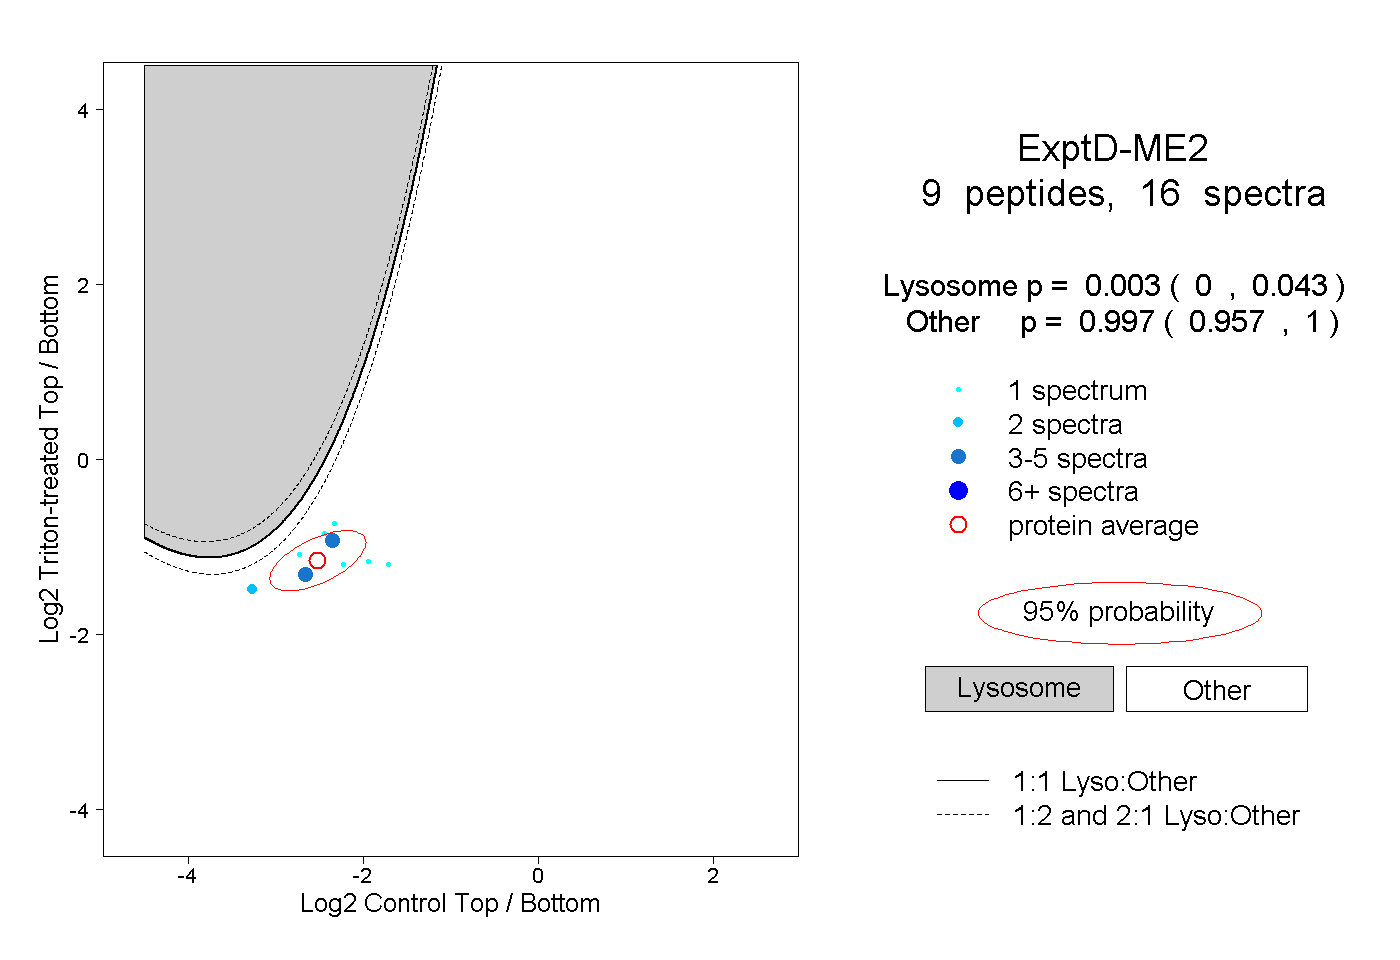 |
0.003 0.000 | 0.043 |
0.997 0.957 | 1.000 |