 25
25peptides
spectra
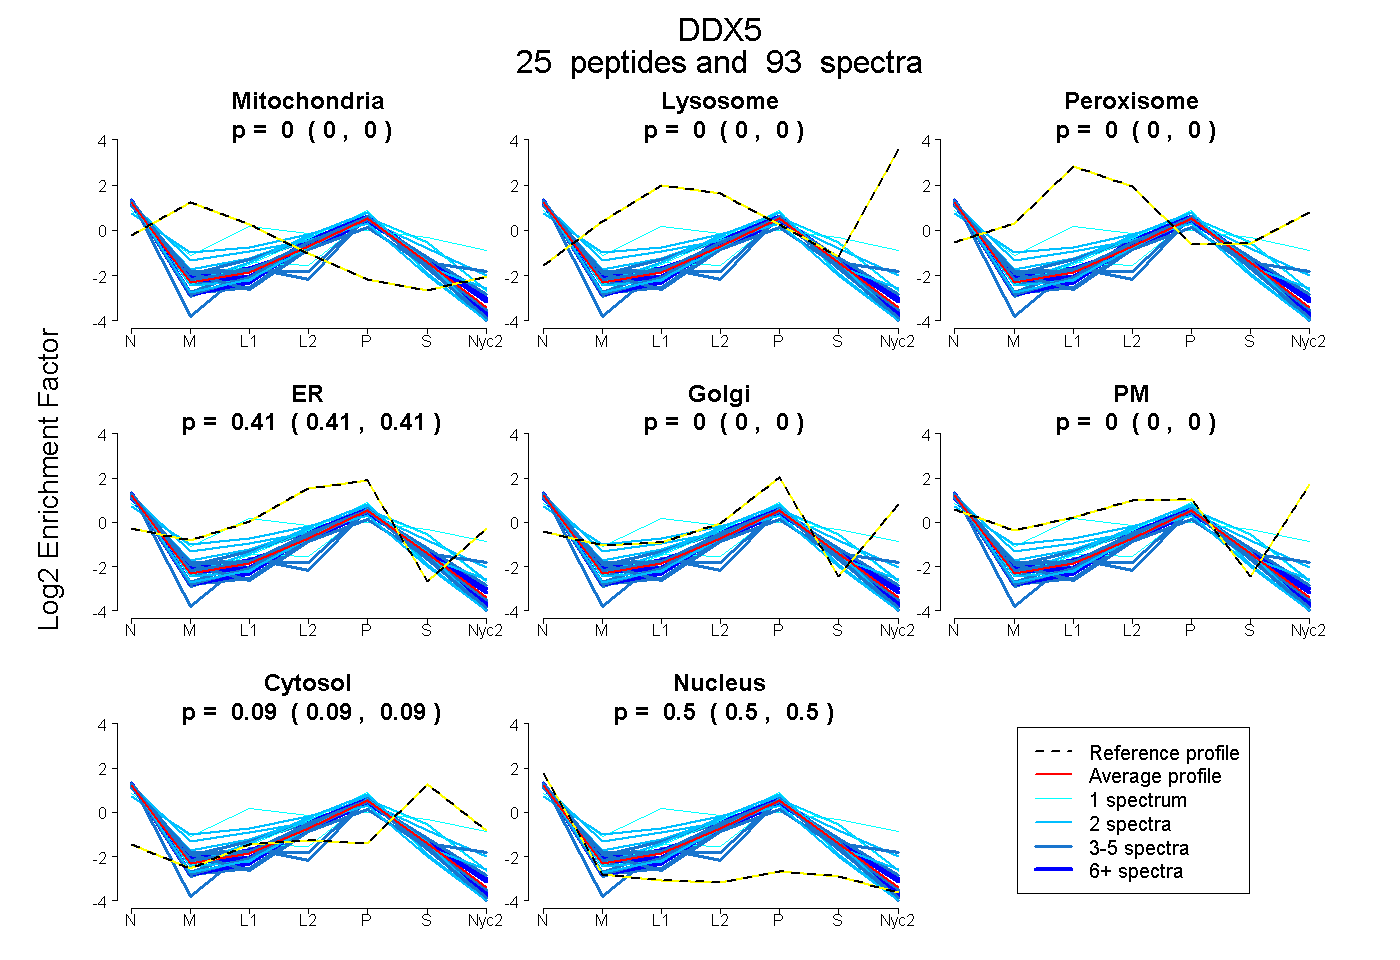
0.000 | 0.000
0.000 | 0.000
0.000 | 0.000
0.406 | 0.410
0.000 | 0.000
0.000 | 0.000
0.090 | 0.095
0.496 | 0.501
7peptides
spectra
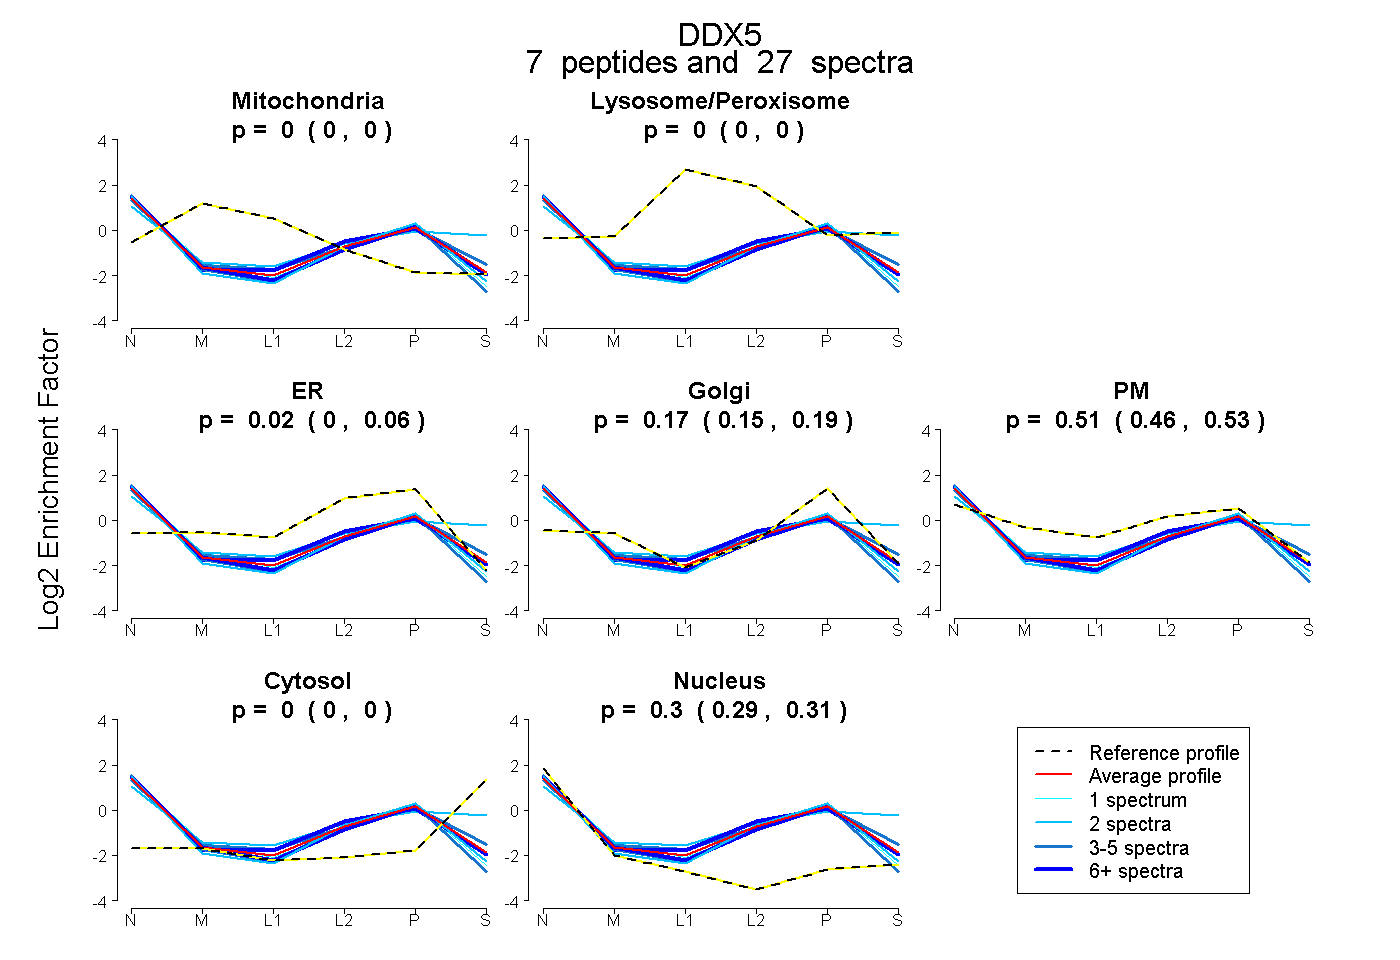
0.000 | 0.000
0.000 | 0.000
0.000 | 0.056
0.149 | 0.189
0.463 | 0.531
0.000 | 0.000
0.293 | 0.313
15peptides
spectra
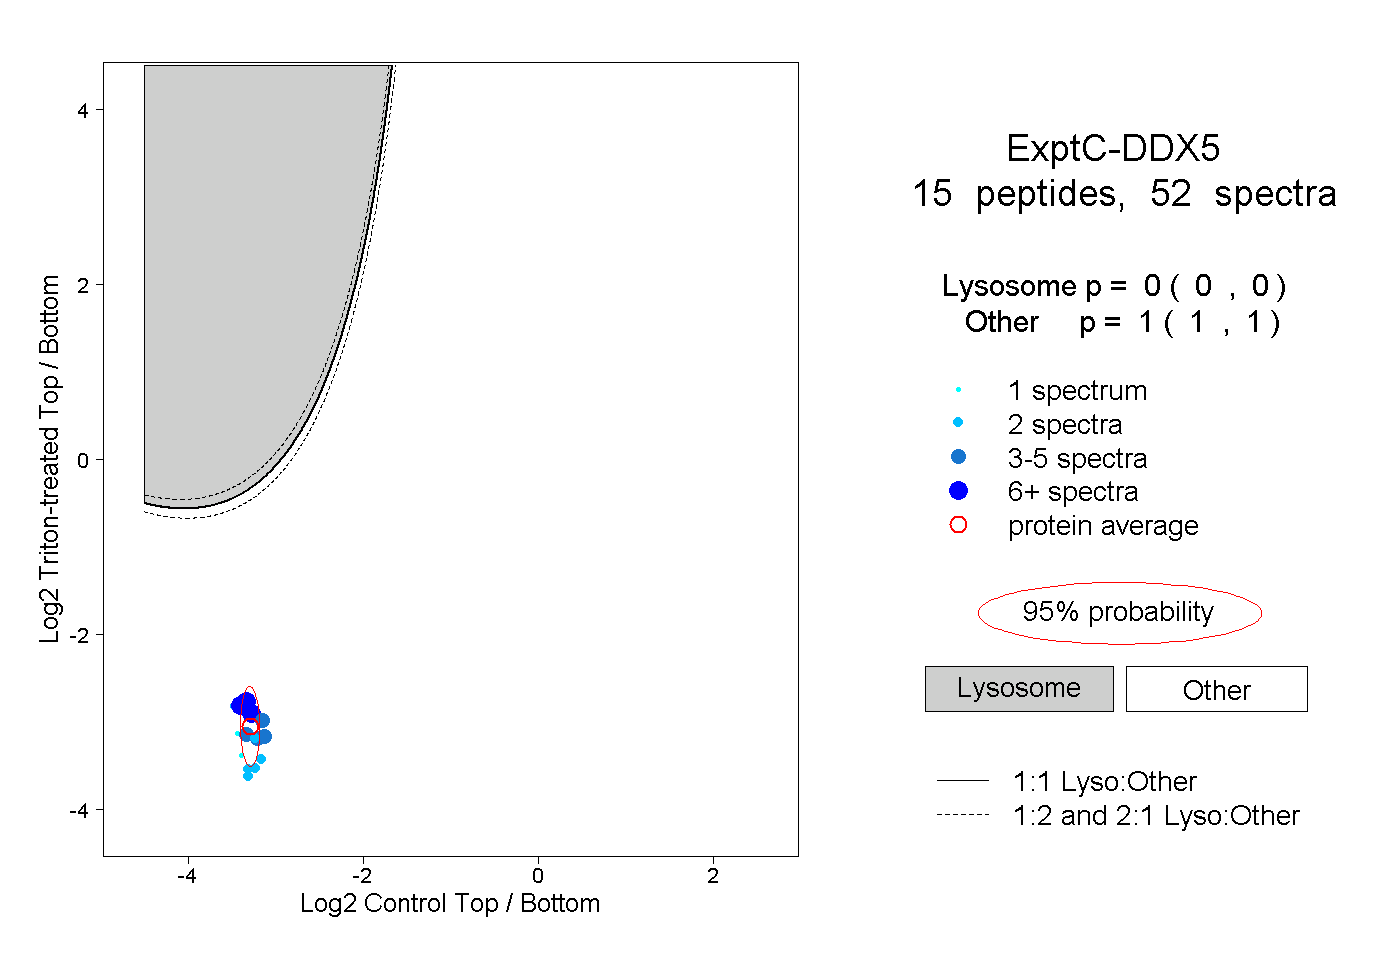
0.000 | 0.000
1.000 | 1.000
6peptides
spectra
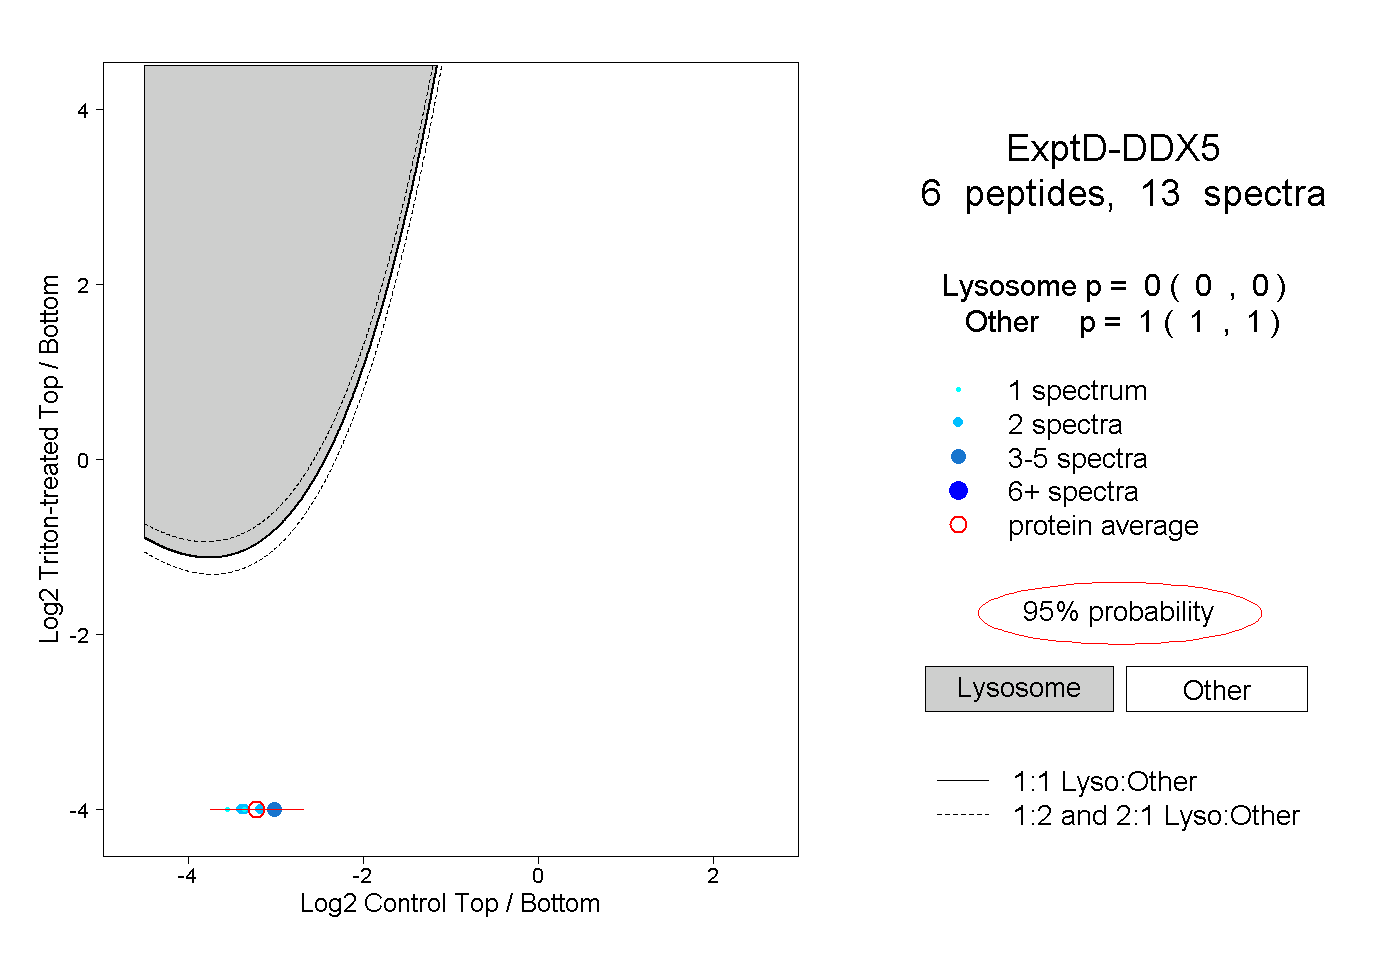
0.000 | 0.000
1.000 | 1.000