DDX5
[ENSRNOP00000041663]
Main page
| | | Plot |
Mito |
Lyso |
|
Perox |
ER |
Golgi |
PM |
Cytosol |
Nucleus |
|
| Expt A |
 25
25
peptides |
93
spectra |
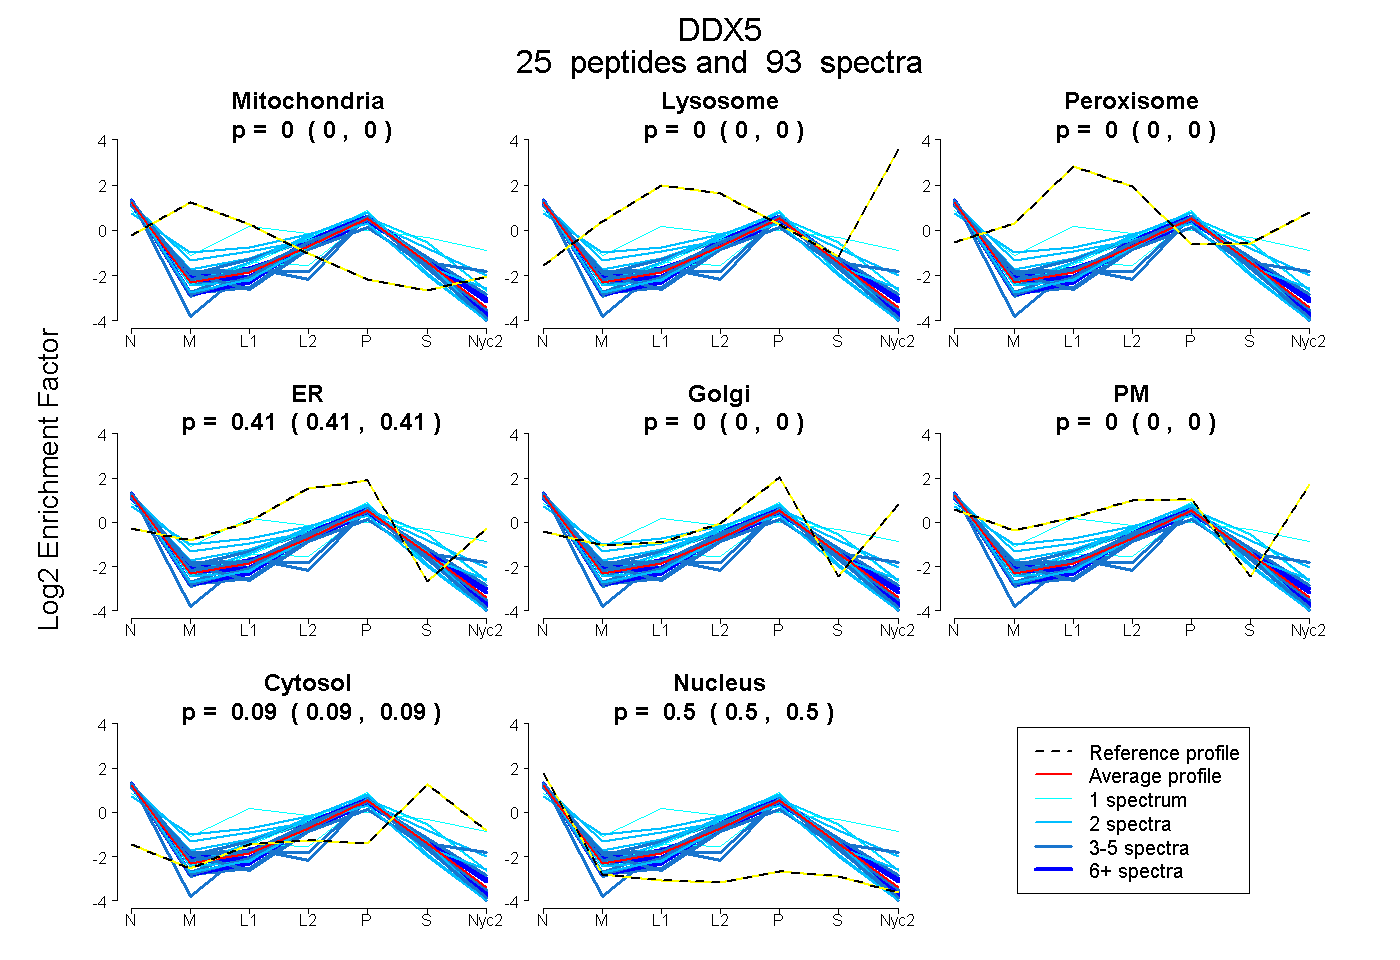 |
0.000
0.000 | 0.000 |
0.000
0.000 | 0.000 |
|
0.000
0.000 | 0.000 |
0.409
0.406 | 0.410 |
0.000
0.000 | 0.000 |
0.000
0.000 | 0.000 |
0.093
0.090 | 0.095 |
0.499
0.496 | 0.501 |
|
| | | Plot |
Mito |
|
Lyso or Perox |
|
ER |
Golgi |
PM |
Cytosol |
Nucleus |
|
| Expt B |
7
peptides |
27
spectra |
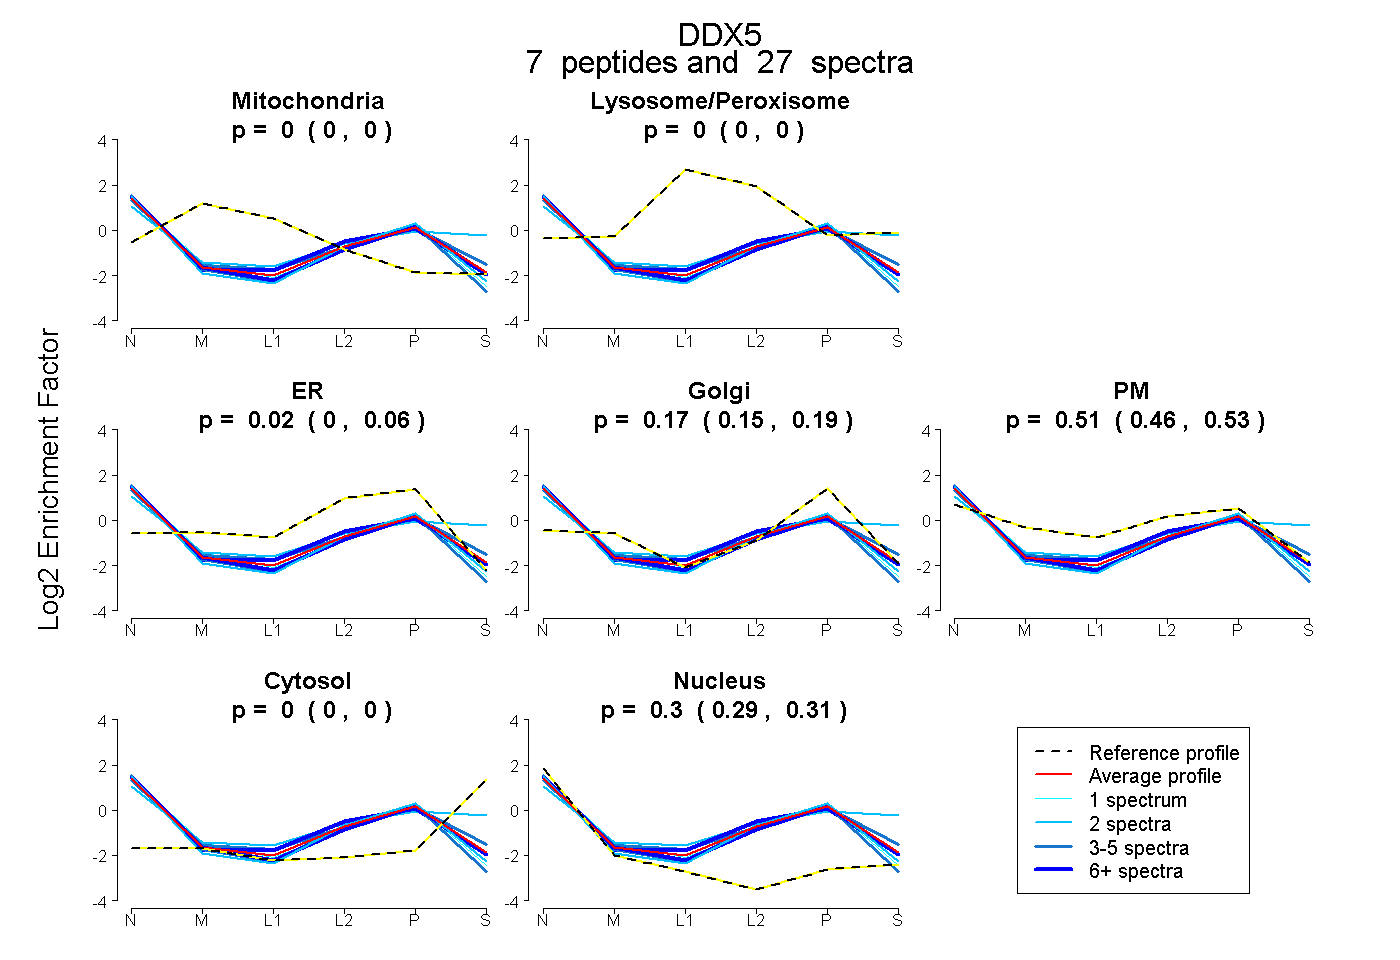 |
0.000
0.000 | 0.000 |
|
0.000
0.000 | 0.000 |
|
0.015
0.000 | 0.056 |
0.174
0.149 | 0.189 |
0.510
0.463 | 0.531 |
0.000
0.000 | 0.000 |
0.300
0.293 | 0.313 |
|
| 5 spectra, IVDQIRPDR |
0.000 |
|
0.000 |
|
0.000 |
0.110 |
0.595 |
0.029 |
0.265 |
|
| 2 spectra, TTYLVLDEADR |
0.000 |
|
0.000 |
|
0.215 |
0.191 |
0.223 |
0.000 |
0.372 |
|
| 7 spectra, QVSDLISVLR |
0.000 |
|
0.000 |
|
0.000 |
0.254 |
0.426 |
0.000 |
0.320 |
|
| 6 spectra, LIDFLECGK |
0.000 |
|
0.000 |
|
0.159 |
0.000 |
0.517 |
0.000 |
0.323 |
|
| 4 spectra, LLQLVEDR |
0.000 |
|
0.000 |
|
0.312 |
0.101 |
0.181 |
0.000 |
0.405 |
|
| 1 spectrum, APILIATDVASR |
0.000 |
|
0.000 |
|
0.024 |
0.227 |
0.434 |
0.000 |
0.314 |
|
| 2 spectra, GVEICIATPGR |
0.000 |
|
0.000 |
|
0.000 |
0.000 |
0.624 |
0.279 |
0.098 |
|
| | | Plot |
|
Lyso |
|
|
|
|
|
|
|
Other |
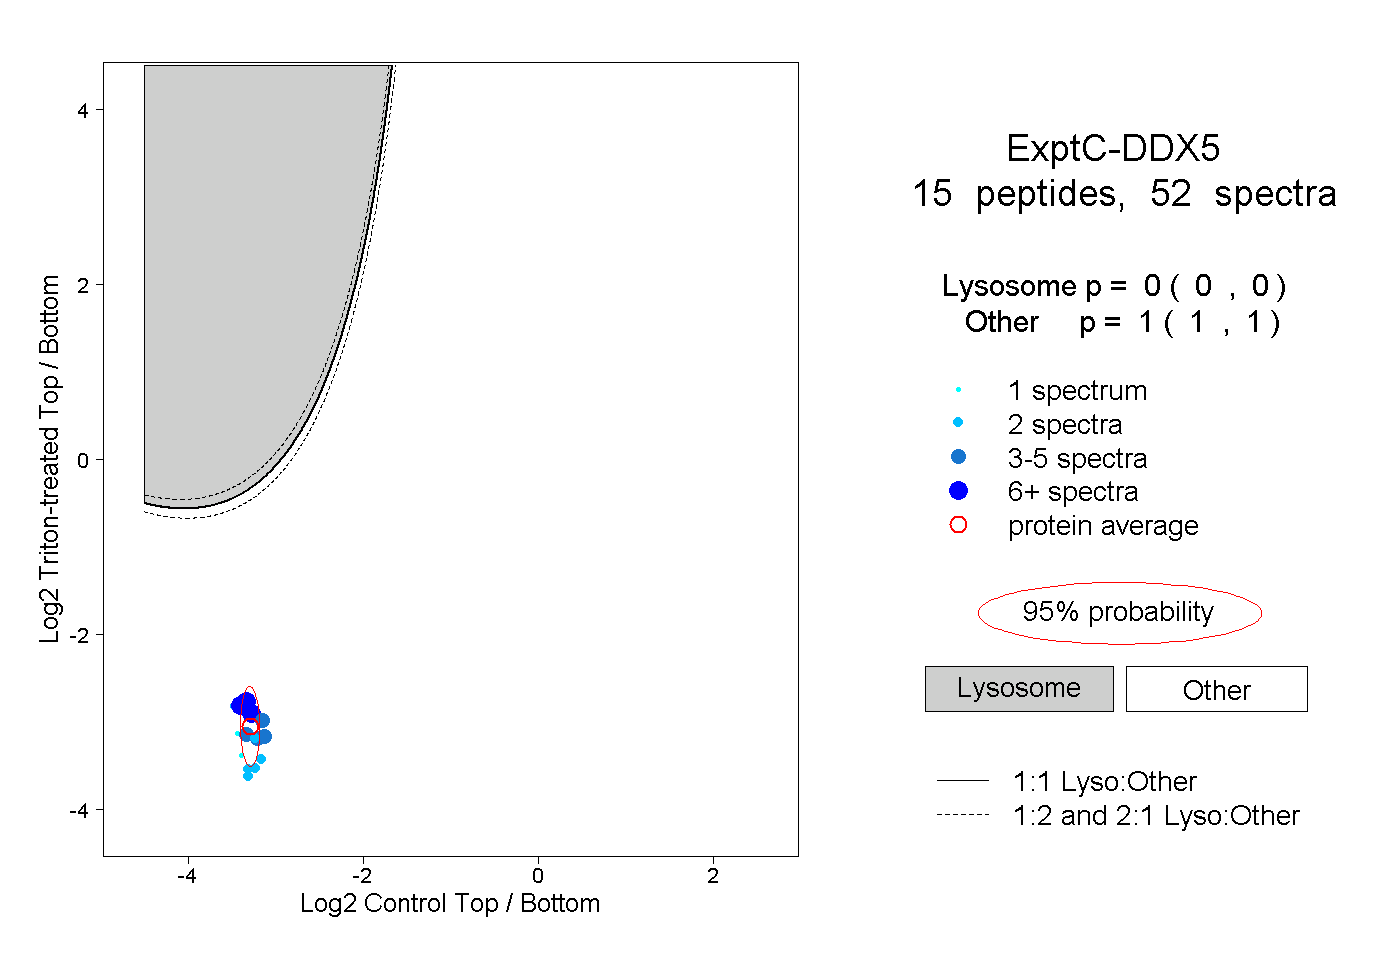
| Expt C |
15
peptides |
52
spectra |
 |
|
0.000
0.000 | 0.000 |
|
|
|
|
|
|
|
1.000
1.000 | 1.000 |
| | | Plot |
|
Lyso |
|
|
|
|
|
|
|
Other |
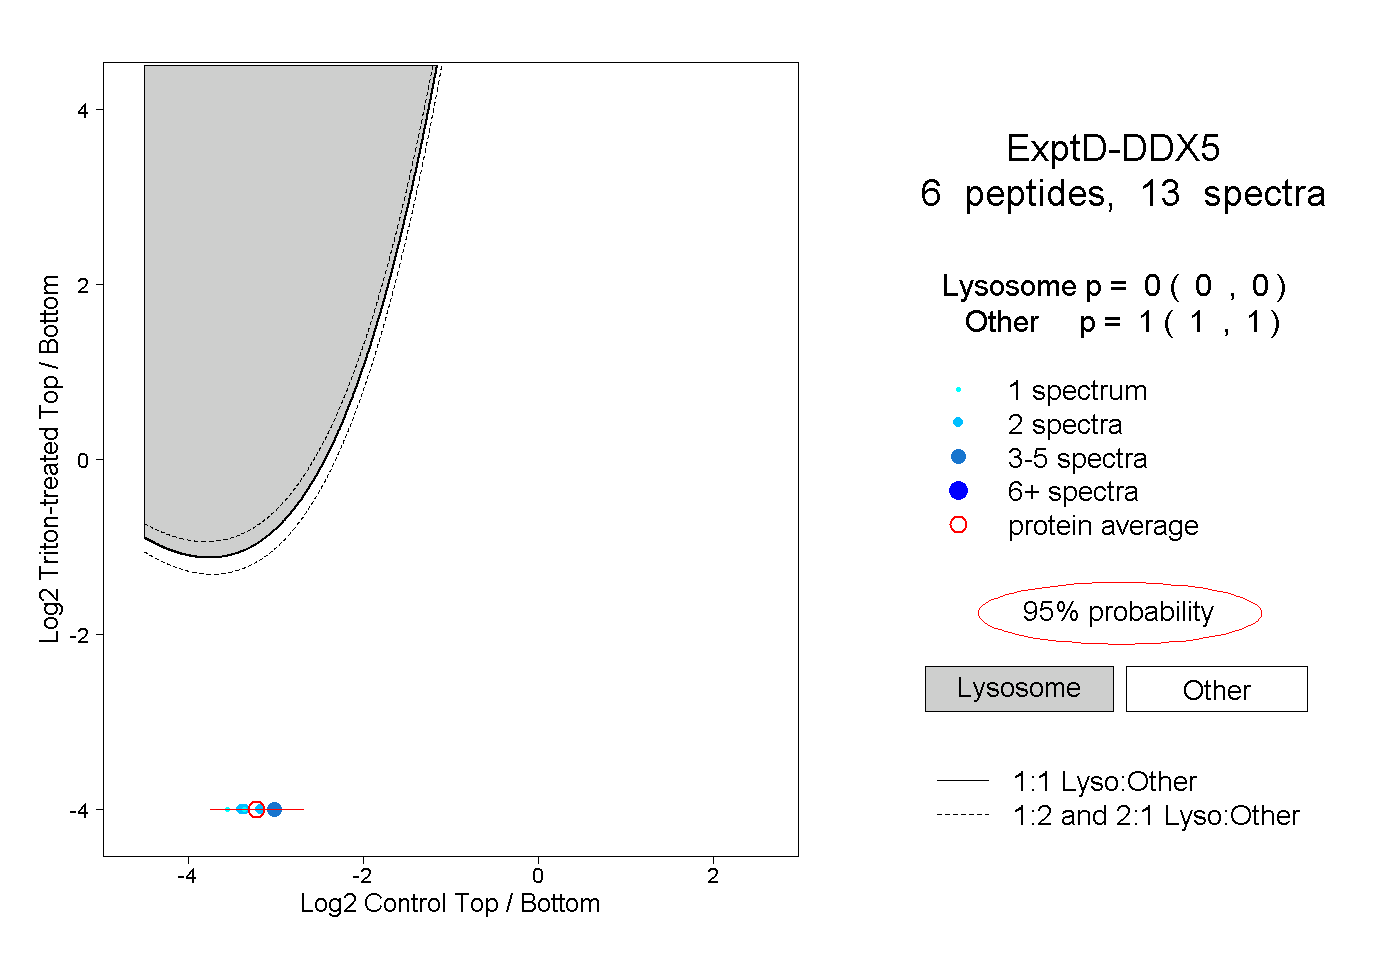
| Expt D |
6
peptides |
13
spectra |
 |
|
0.000
0.000 | 0.000 |
|
|
|
|
|
|
|
1.000
1.000 | 1.000 |