 25
25peptides
spectra
0.000 | 0.000
0.000 | 0.000
0.000 | 0.000
0.406 | 0.410
0.000 | 0.000
0.000 | 0.000
0.090 | 0.095
0.496 | 0.501
| Plot | Mito | Lyso | Perox | ER | Golgi | PM | Cytosol | Nucleus | |||||
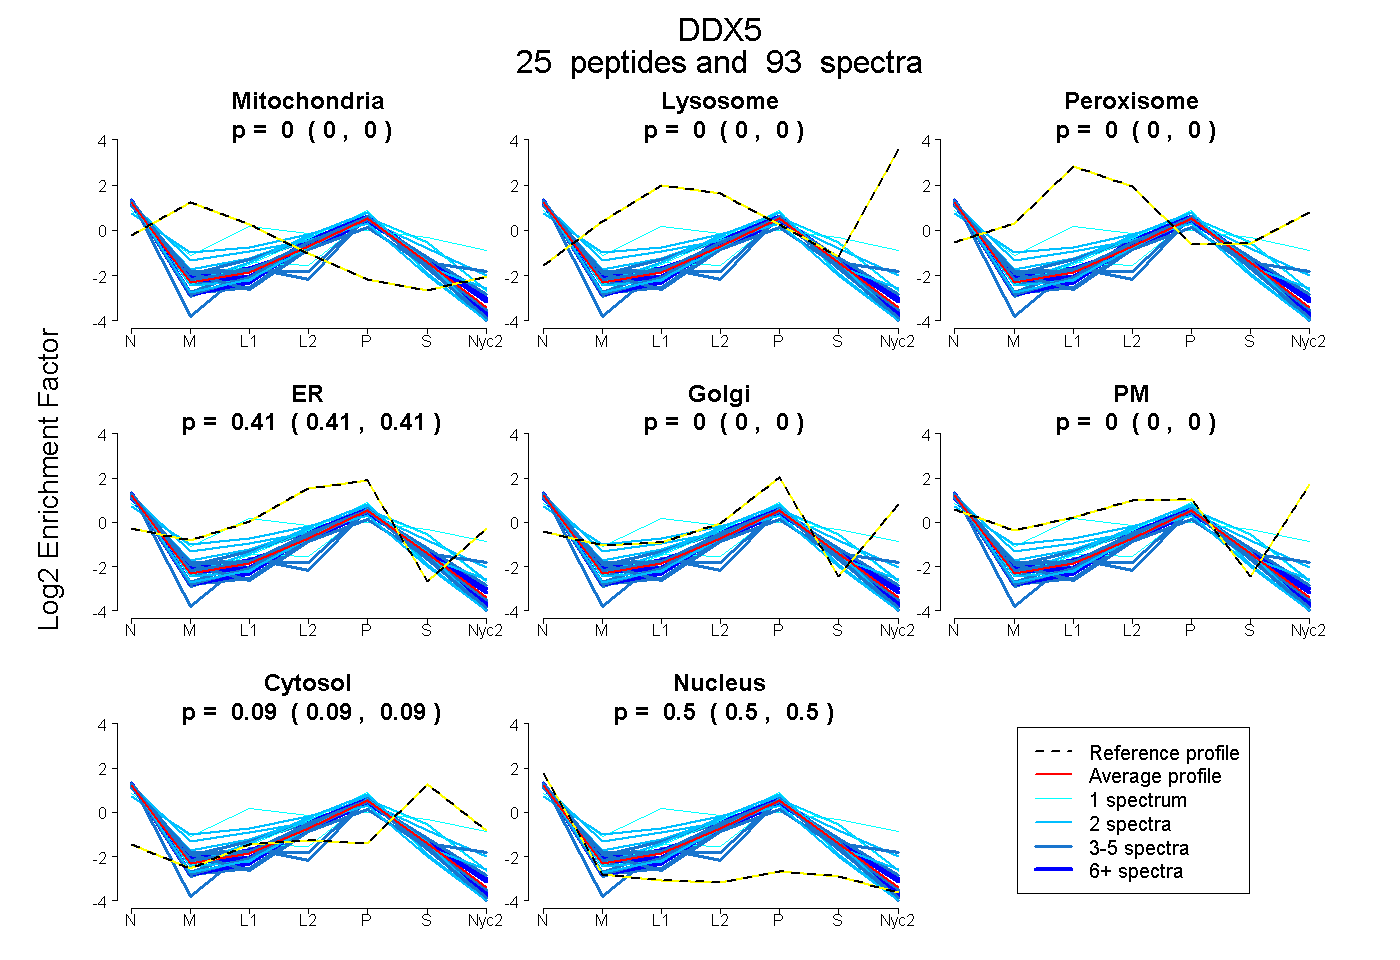
| Expt A |
25 peptides |
93 spectra |
|
0.000 0.000 | 0.000 |
0.000 0.000 | 0.000 |
0.000 0.000 | 0.000 |
0.409 0.406 | 0.410 |
0.000 0.000 | 0.000 |
0.000 0.000 | 0.000 |
0.093 0.090 | 0.095 |
0.499 0.496 | 0.501 |
| 4 spectra, IVDQIRPDR | 0.000 | 0.000 | 0.000 | 0.430 | 0.000 | 0.000 | 0.045 | 0.526 | ||
| 3 spectra, TTYLVLDEADR | 0.000 | 0.000 | 0.000 | 0.449 | 0.000 | 0.000 | 0.009 | 0.542 | ||
| 2 spectra, TIVFVETK | 0.000 | 0.000 | 0.000 | 0.361 | 0.000 | 0.000 | 0.080 | 0.559 | ||
| 5 spectra, QLAEDFLK | 0.000 | 0.000 | 0.000 | 0.425 | 0.000 | 0.000 | 0.150 | 0.424 | ||
| 5 spectra, QVSDLISVLR | 0.000 | 0.000 | 0.000 | 0.372 | 0.000 | 0.000 | 0.089 | 0.539 | ||
| 2 spectra, CDELTR | 0.000 | 0.000 | 0.000 | 0.462 | 0.000 | 0.000 | 0.249 | 0.289 | ||
| 6 spectra, LMEEIMSEK | 0.000 | 0.000 | 0.000 | 0.428 | 0.000 | 0.000 | 0.044 | 0.527 | ||
| 10 spectra, GLDVEDVK | 0.000 | 0.000 | 0.000 | 0.405 | 0.000 | 0.000 | 0.140 | 0.455 | ||
| 4 spectra, EANQAINPK | 0.000 | 0.000 | 0.000 | 0.353 | 0.000 | 0.000 | 0.051 | 0.597 | ||
| 4 spectra, GVEICIATPGR | 0.000 | 0.000 | 0.000 | 0.390 | 0.000 | 0.000 | 0.050 | 0.561 | ||
| 4 spectra, GGFNTFR | 0.000 | 0.000 | 0.000 | 0.000 | 0.362 | 0.000 | 0.165 | 0.473 | ||
| 2 spectra, TGTAYTFFTPNNIK | 0.064 | 0.000 | 0.000 | 0.463 | 0.000 | 0.000 | 0.000 | 0.473 | ||
| 3 spectra, GDGPICLVLAPTR | 0.000 | 0.000 | 0.000 | 0.376 | 0.000 | 0.000 | 0.040 | 0.584 | ||
| 1 spectrum, QTLMWSATWPK | 0.000 | 0.000 | 0.000 | 0.484 | 0.000 | 0.000 | 0.000 | 0.516 | ||
| 4 spectra, DGWPAMGIHGDK | 0.000 | 0.000 | 0.000 | 0.465 | 0.000 | 0.000 | 0.089 | 0.447 | ||
| 2 spectra, TAQEVDTYR | 0.000 | 0.000 | 0.000 | 0.523 | 0.000 | 0.000 | 0.077 | 0.400 | ||
| 6 spectra, DWVLNEFK | 0.000 | 0.000 | 0.000 | 0.422 | 0.000 | 0.000 | 0.110 | 0.468 | ||
| 1 spectrum, FGNPGEK | 0.000 | 0.000 | 0.326 | 0.156 | 0.000 | 0.090 | 0.227 | 0.201 | ||
| 2 spectra, FVINYDYPNSSEDYIHR | 0.066 | 0.000 | 0.012 | 0.451 | 0.000 | 0.000 | 0.250 | 0.221 | ||
| 3 spectra, TGPLSGK | 0.000 | 0.000 | 0.000 | 0.363 | 0.000 | 0.000 | 0.076 | 0.562 | ||
| 3 spectra, STCIYGGAPK | 0.000 | 0.000 | 0.000 | 0.353 | 0.000 | 0.000 | 0.036 | 0.611 | ||
| 9 spectra, LIDFLECGK | 0.000 | 0.000 | 0.000 | 0.388 | 0.000 | 0.000 | 0.056 | 0.556 | ||
| 2 spectra, LLQLVEDR | 0.000 | 0.000 | 0.000 | 0.435 | 0.000 | 0.000 | 0.000 | 0.565 | ||
| 5 spectra, APILIATDVASR | 0.000 | 0.000 | 0.000 | 0.375 | 0.000 | 0.000 | 0.098 | 0.527 | ||
| 1 spectrum, GFGAPR | 0.000 | 0.000 | 0.000 | 0.283 | 0.000 | 0.000 | 0.319 | 0.397 |
| Plot | Mito | Lyso or Perox | ER | Golgi | PM | Cytosol | Nucleus | ||||||
| Expt B |
7 peptides |
27 spectra |
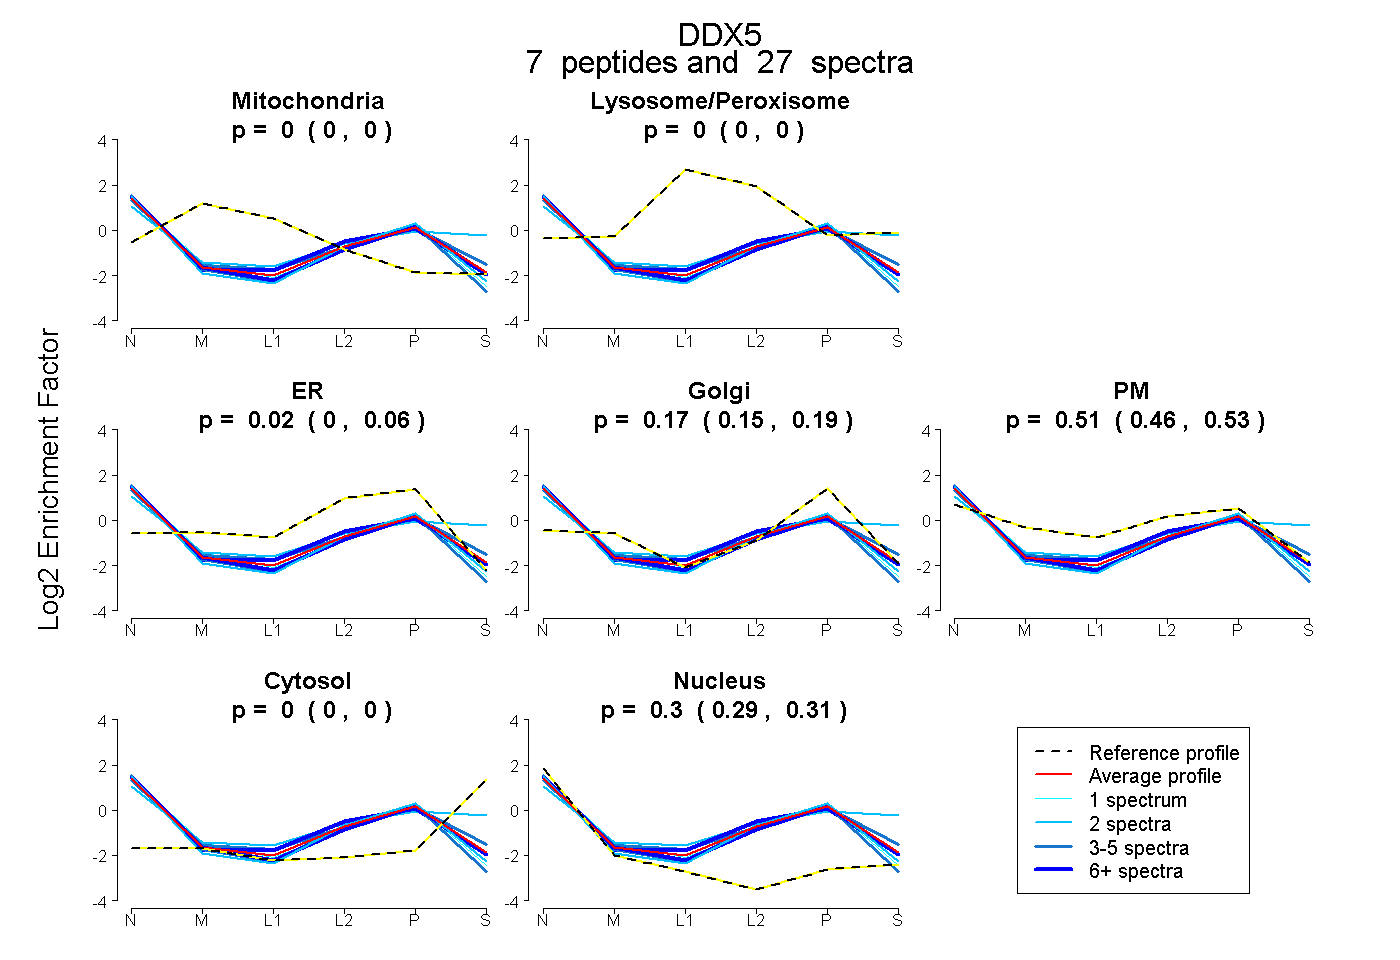 |
0.000 0.000 | 0.000 |
0.000 0.000 | 0.000 |
0.015 0.000 | 0.056 |
0.174 0.149 | 0.189 |
0.510 0.463 | 0.531 |
0.000 0.000 | 0.000 |
0.300 0.293 | 0.313 |
|||
| Plot | Lyso | Other | |||||||||||
| Expt C |
15 peptides |
52 spectra |
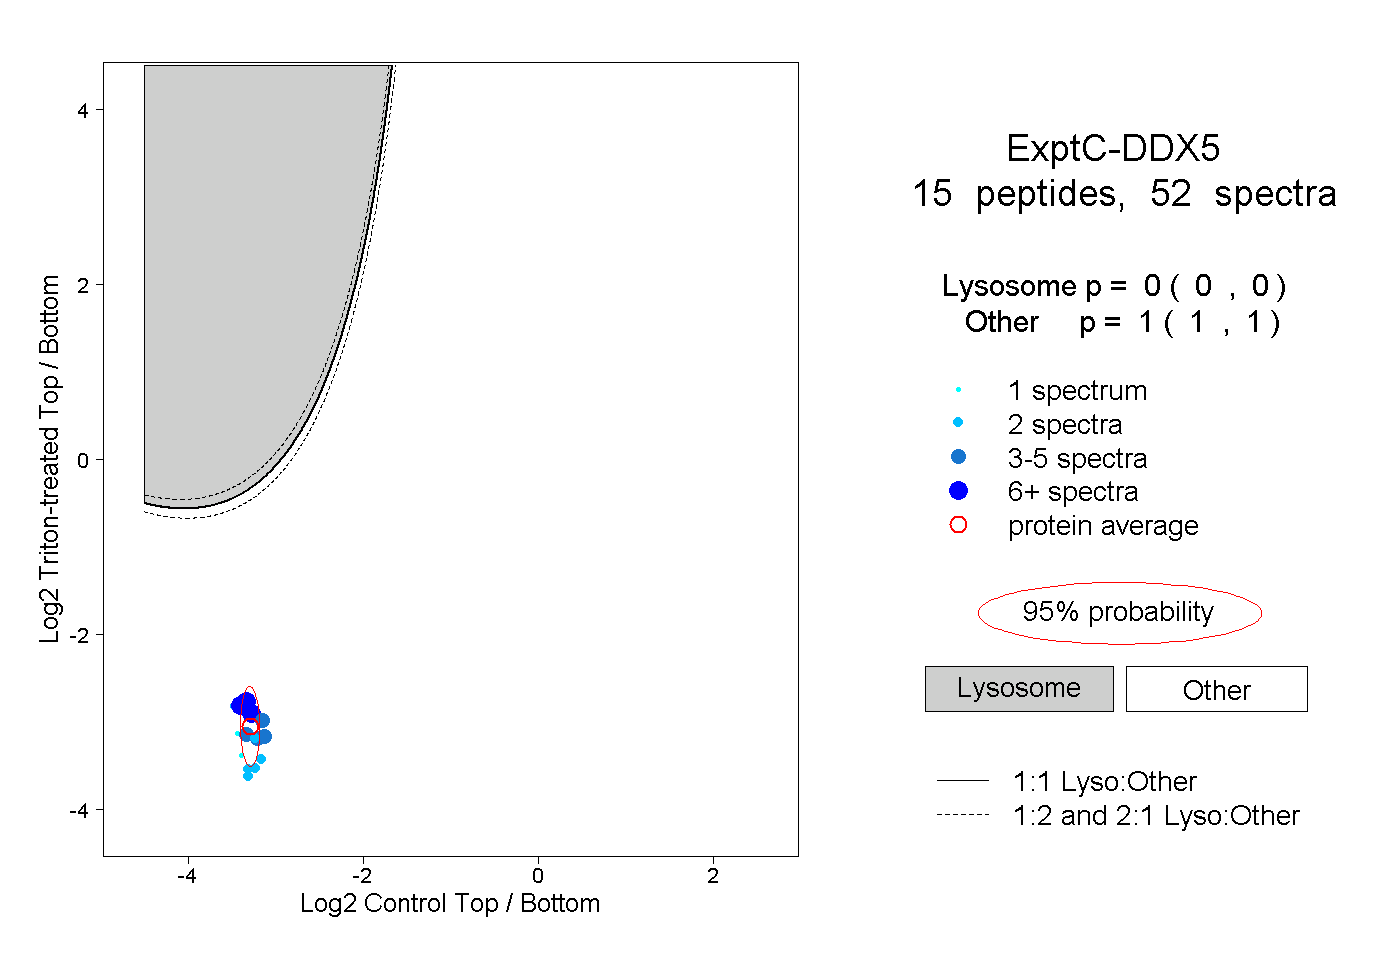 |
0.000 0.000 | 0.000 |
1.000 1.000 | 1.000 |
||||||||
| Plot | Lyso | Other | |||||||||||
| Expt D |
6 peptides |
13 spectra |
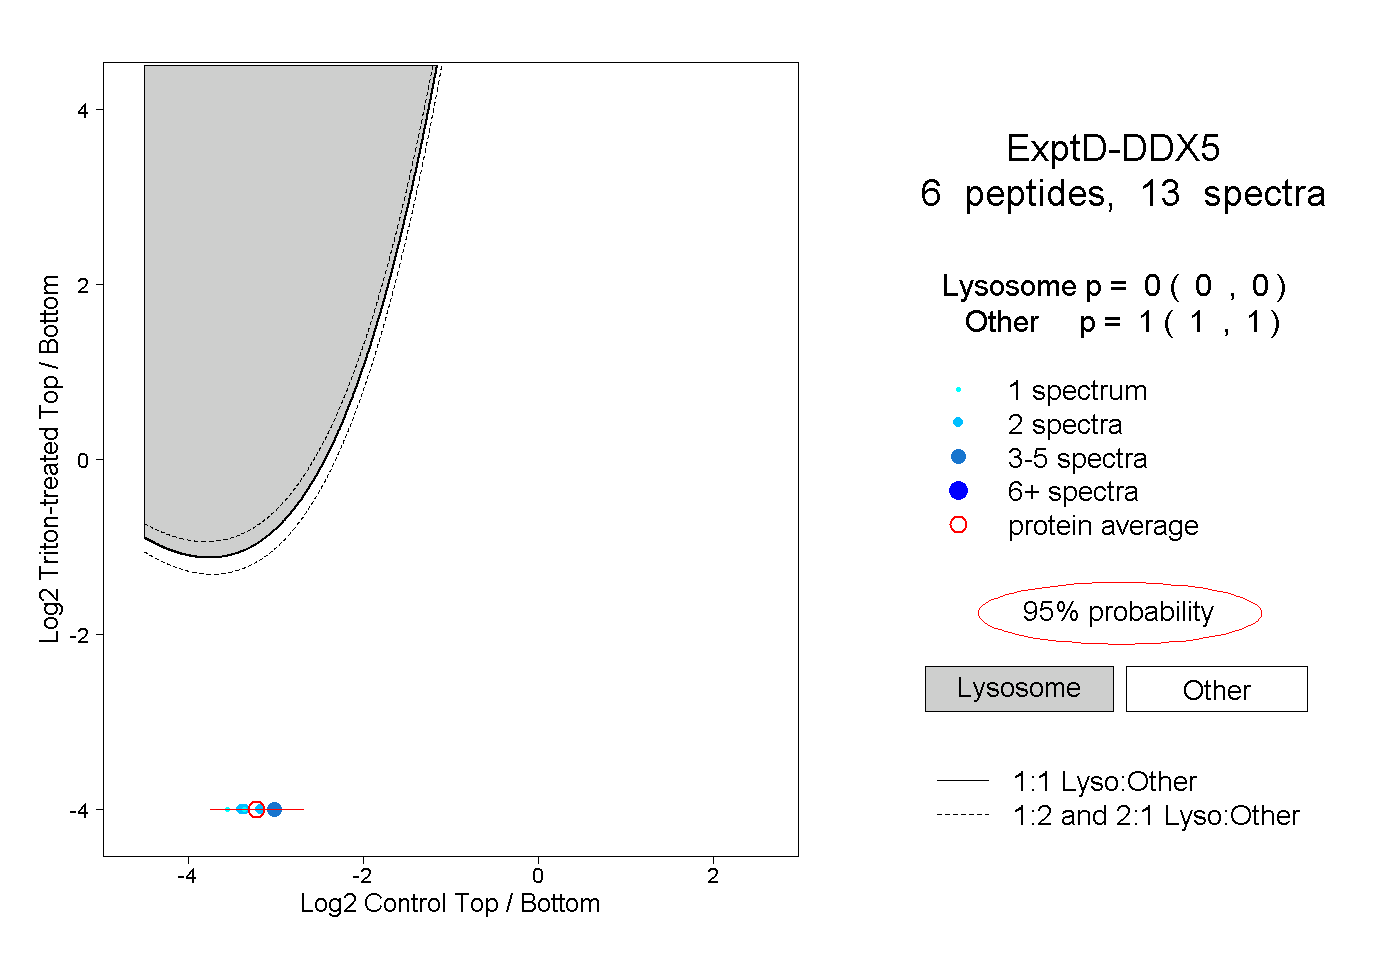 |
0.000 0.000 | 0.000 |
1.000 1.000 | 1.000 |