 11
11peptides
spectra
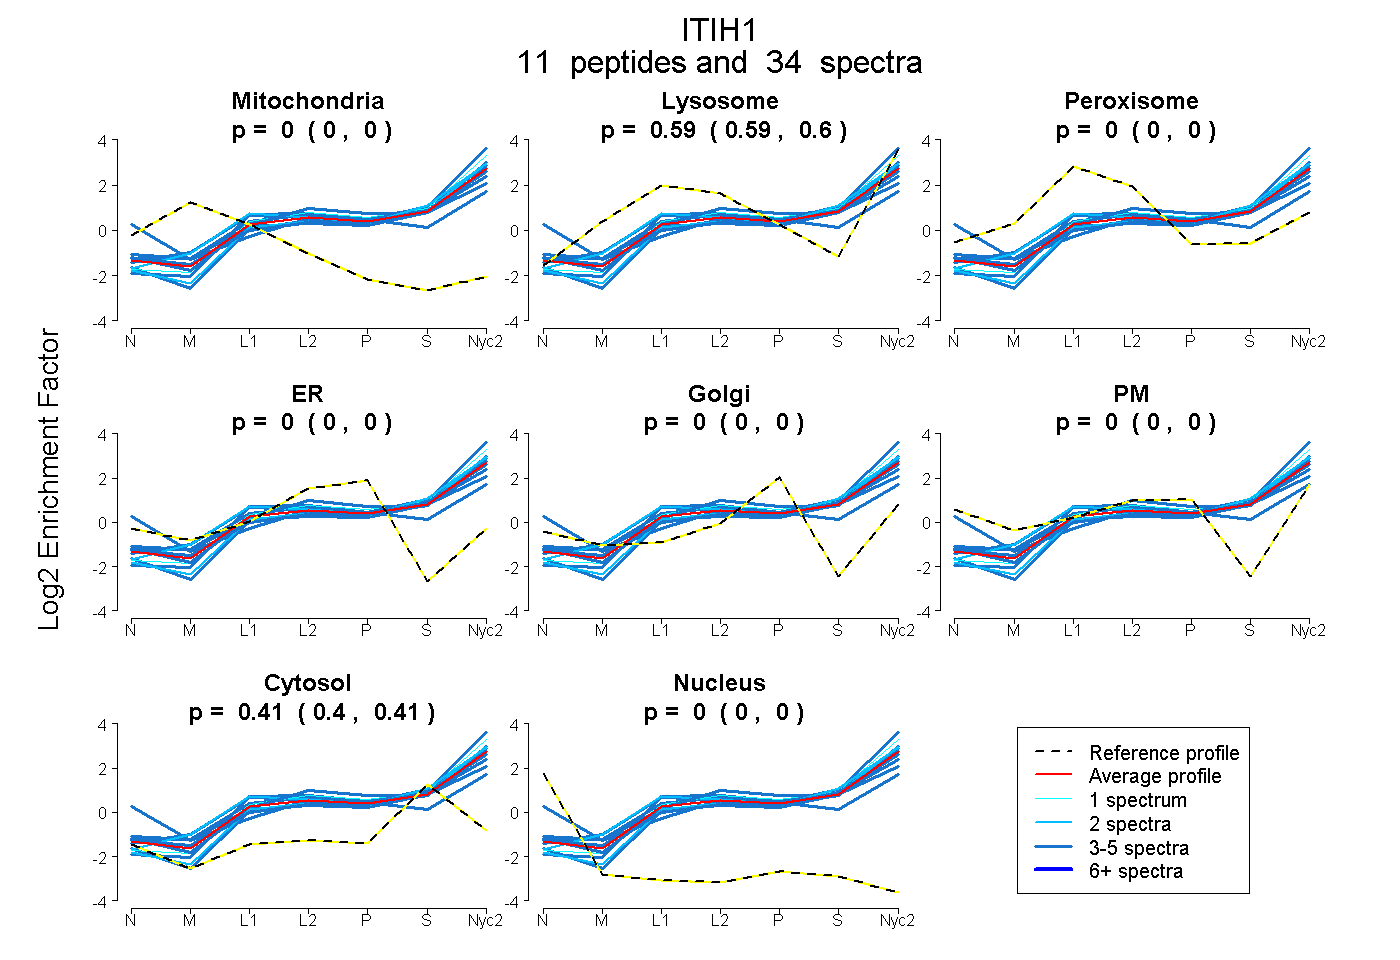
0.000 | 0.000
0.587 | 0.597
0.000 | 0.000
0.000 | 0.000
0.000 | 0.000
0.000 | 0.000
0.402 | 0.412
0.000 | 0.000
9peptides
spectra
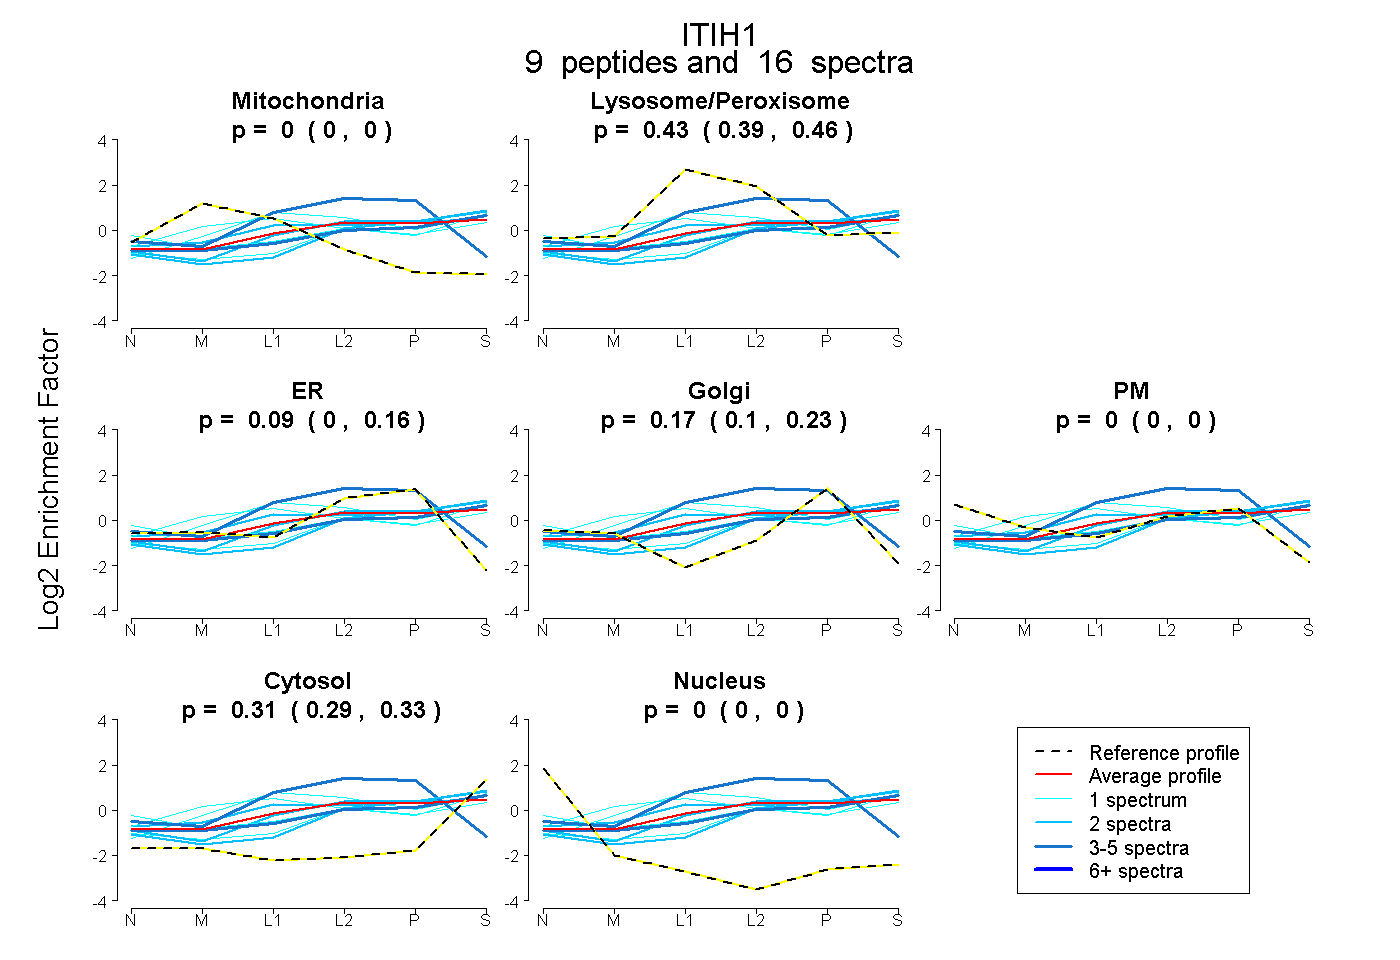
0.000 | 0.000
0.389 | 0.459
0.002 | 0.157
0.100 | 0.232
0.000 | 0.000
0.288 | 0.334
0.000 | 0.000
20peptides
spectra
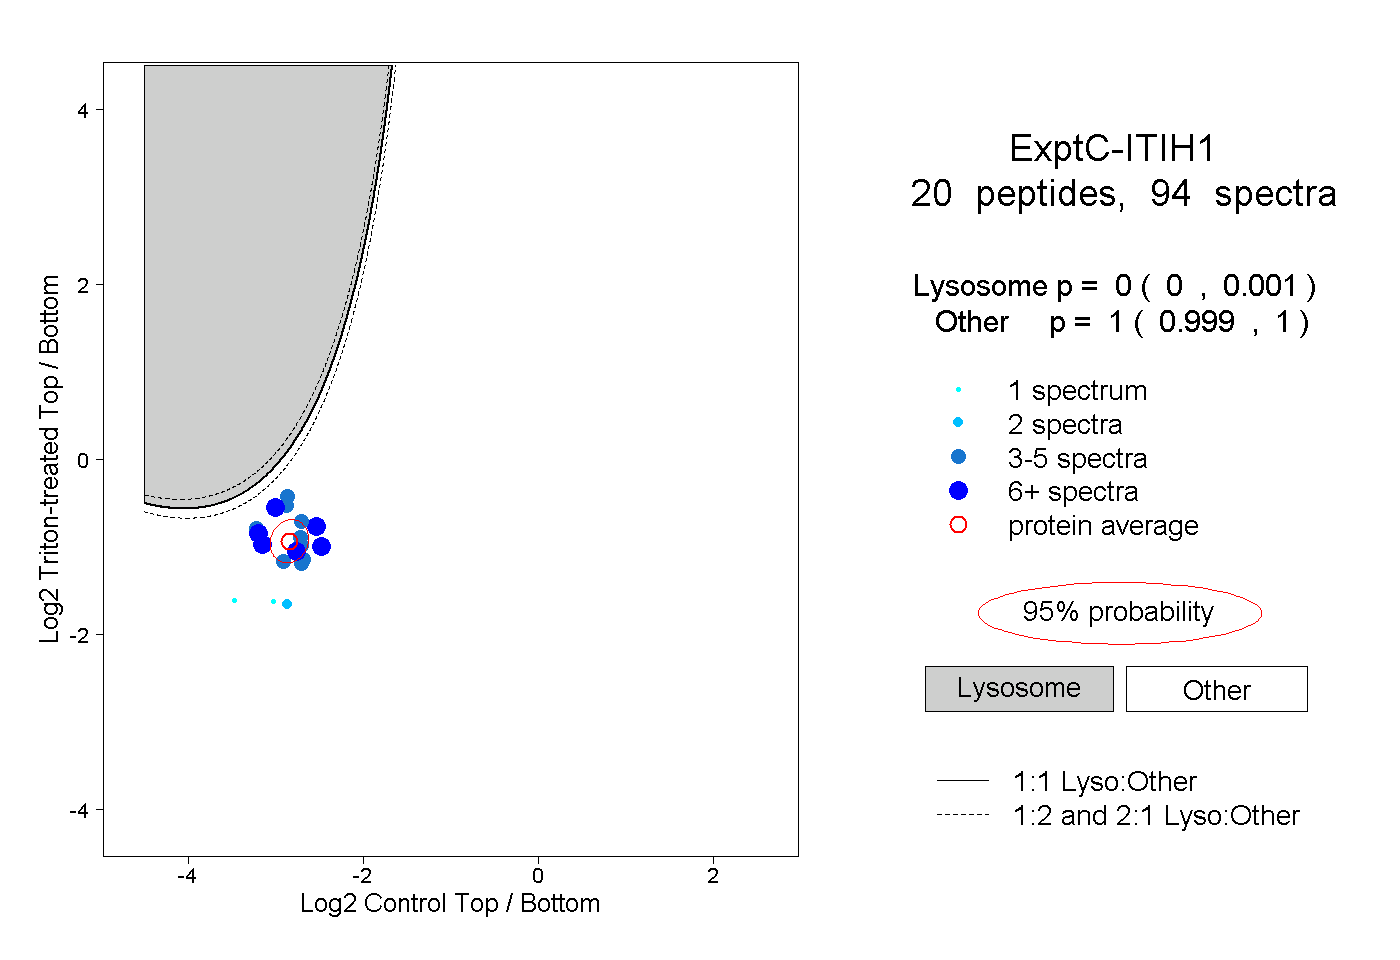
0.000 | 0.001
0.999 | 1.000
6peptides
spectra
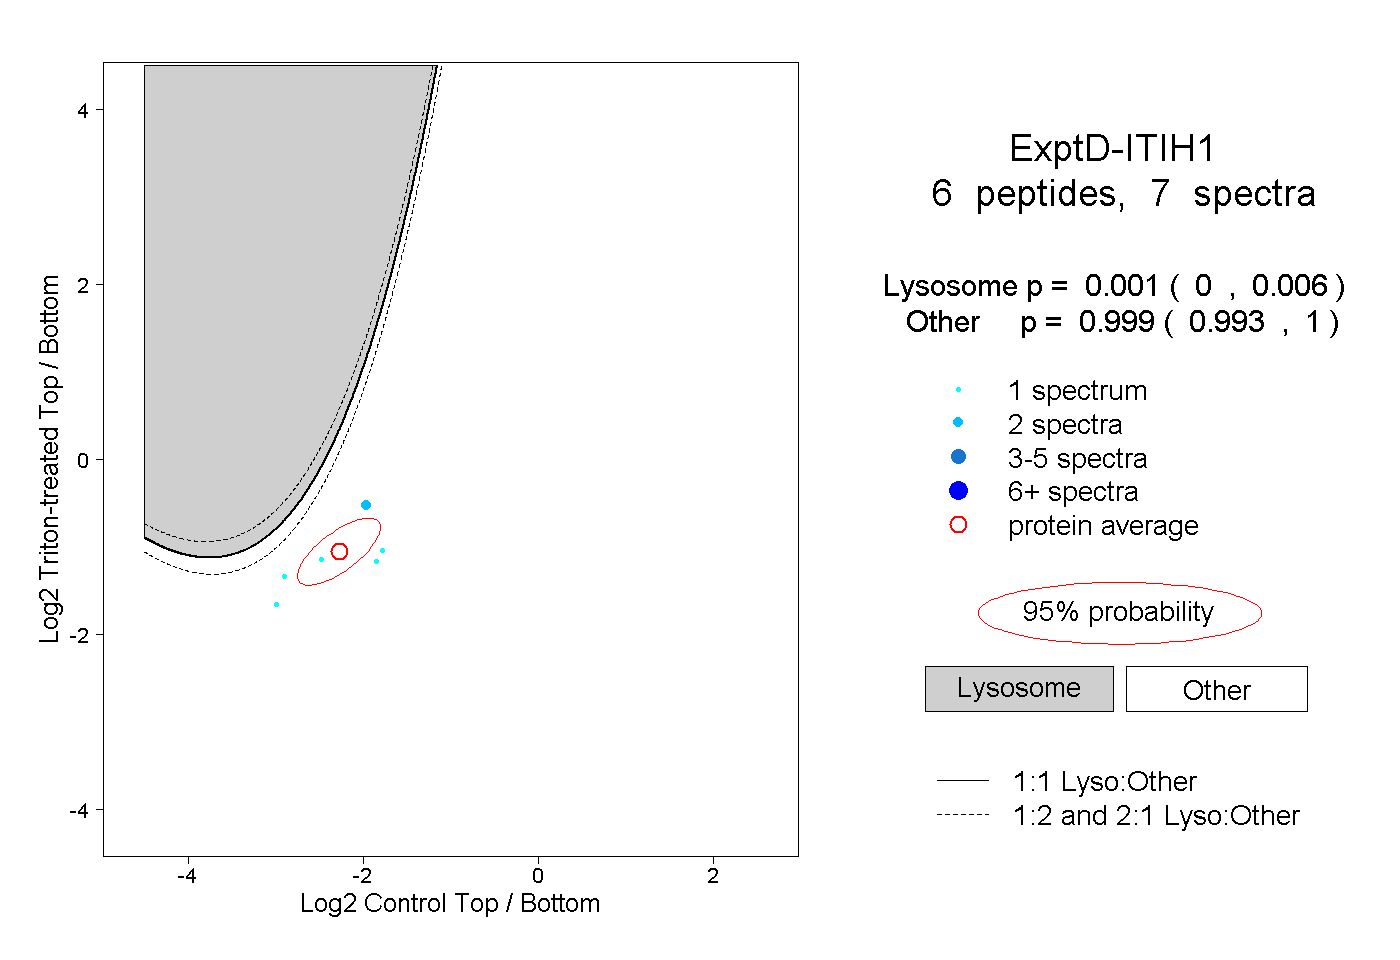
0.000 | 0.006
0.993 | 1.000