 11
11peptides
spectra
0.000 | 0.000
0.587 | 0.597
0.000 | 0.000
0.000 | 0.000
0.000 | 0.000
0.000 | 0.000
0.402 | 0.412
0.000 | 0.000
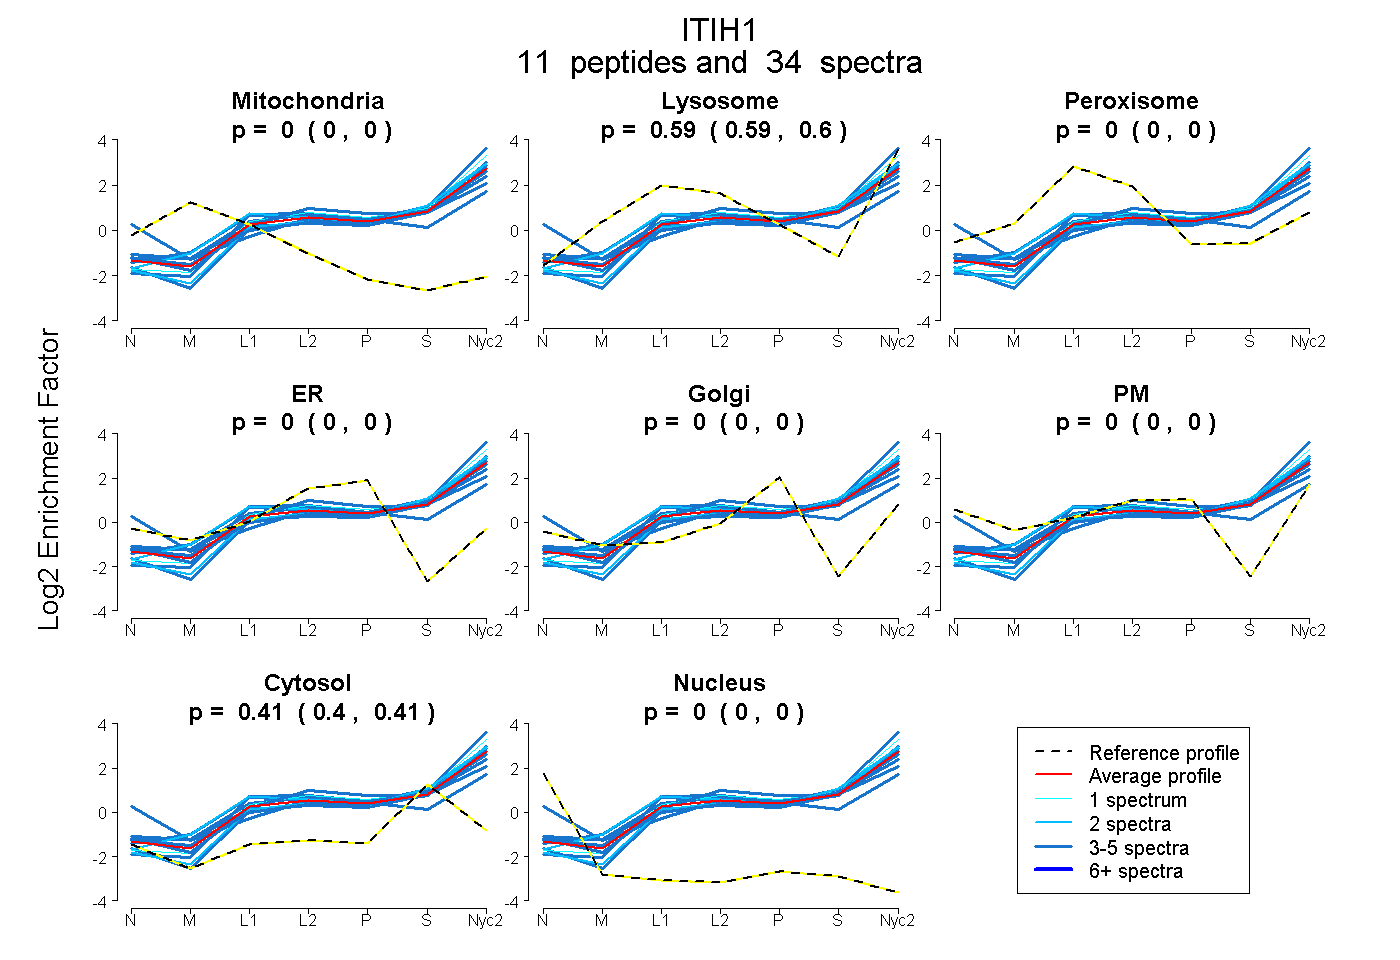
| Plot | Mito | Lyso | Perox | ER | Golgi | PM | Cytosol | Nucleus | |||||
| Expt A |
11 peptides |
34 spectra |
|
0.000 0.000 | 0.000 |
0.592 0.587 | 0.597 |
0.000 0.000 | 0.000 |
0.000 0.000 | 0.000 |
0.000 0.000 | 0.000 |
0.000 0.000 | 0.000 |
0.408 0.402 | 0.412 |
0.000 0.000 | 0.000 |
| 1 spectrum, LDAQASFLSK | 0.000 | 0.642 | 0.000 | 0.000 | 0.000 | 0.000 | 0.358 | 0.000 | ||
| 2 spectra, GSLVPASHANLQAAQDFVR | 0.000 | 0.669 | 0.000 | 0.000 | 0.000 | 0.000 | 0.331 | 0.000 | ||
| 4 spectra, ELAAQTIK | 0.000 | 0.559 | 0.000 | 0.000 | 0.000 | 0.000 | 0.441 | 0.000 | ||
| 5 spectra, GHMLENHVER | 0.000 | 0.184 | 0.000 | 0.000 | 0.000 | 0.453 | 0.363 | 0.000 | ||
| 4 spectra, AAISGENAGLVR | 0.000 | 0.526 | 0.000 | 0.000 | 0.000 | 0.000 | 0.474 | 0.000 | ||
| 3 spectra, ATFQLTYEEVLK | 0.000 | 0.669 | 0.000 | 0.000 | 0.000 | 0.000 | 0.331 | 0.000 | ||
| 3 spectra, ATCLVDEEEMK | 0.000 | 0.594 | 0.000 | 0.000 | 0.000 | 0.000 | 0.406 | 0.000 | ||
| 4 spectra, VTYDVNR | 0.000 | 0.559 | 0.000 | 0.000 | 0.000 | 0.000 | 0.441 | 0.000 | ||
| 2 spectra, QYYDGSEIVVAGR | 0.000 | 0.543 | 0.000 | 0.000 | 0.000 | 0.000 | 0.457 | 0.000 | ||
| 3 spectra, QAVDTTVNGVSIR | 0.000 | 0.589 | 0.000 | 0.000 | 0.041 | 0.000 | 0.370 | 0.000 | ||
| 3 spectra, GIEILNR | 0.000 | 0.646 | 0.000 | 0.000 | 0.000 | 0.000 | 0.354 | 0.000 |
| Plot | Mito | Lyso or Perox | ER | Golgi | PM | Cytosol | Nucleus | ||||||
| Expt B |
9 peptides |
16 spectra |
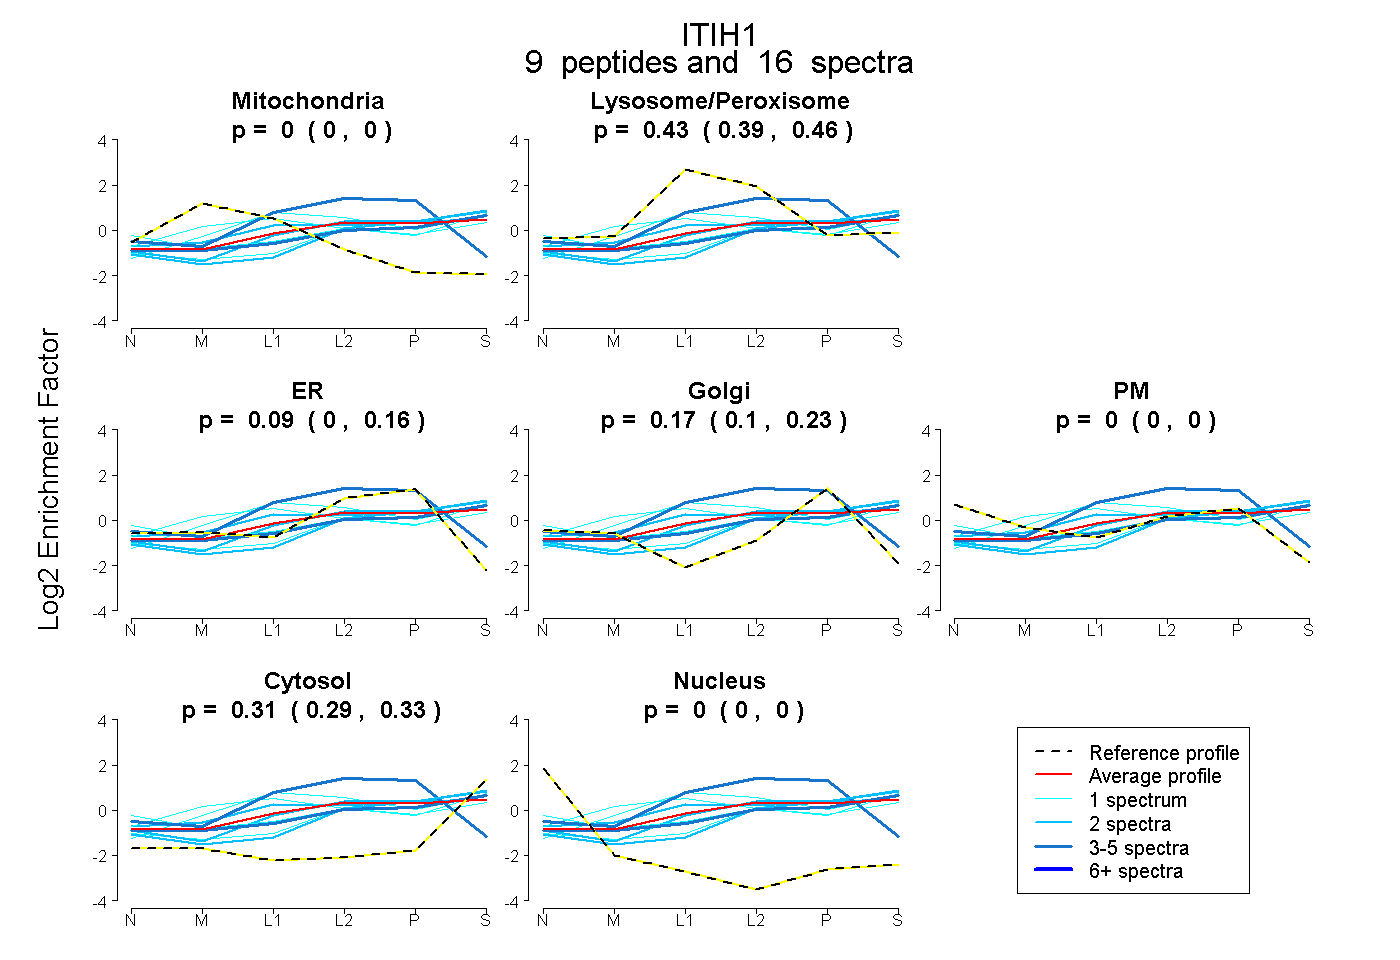 |
0.000 0.000 | 0.000 |
0.427 0.389 | 0.459 |
0.086 0.002 | 0.157 |
0.173 0.100 | 0.232 |
0.000 0.000 | 0.000 |
0.313 0.288 | 0.334 |
0.000 0.000 | 0.000 |
|||
| Plot | Lyso | Other | |||||||||||
| Expt C |
20 peptides |
94 spectra |
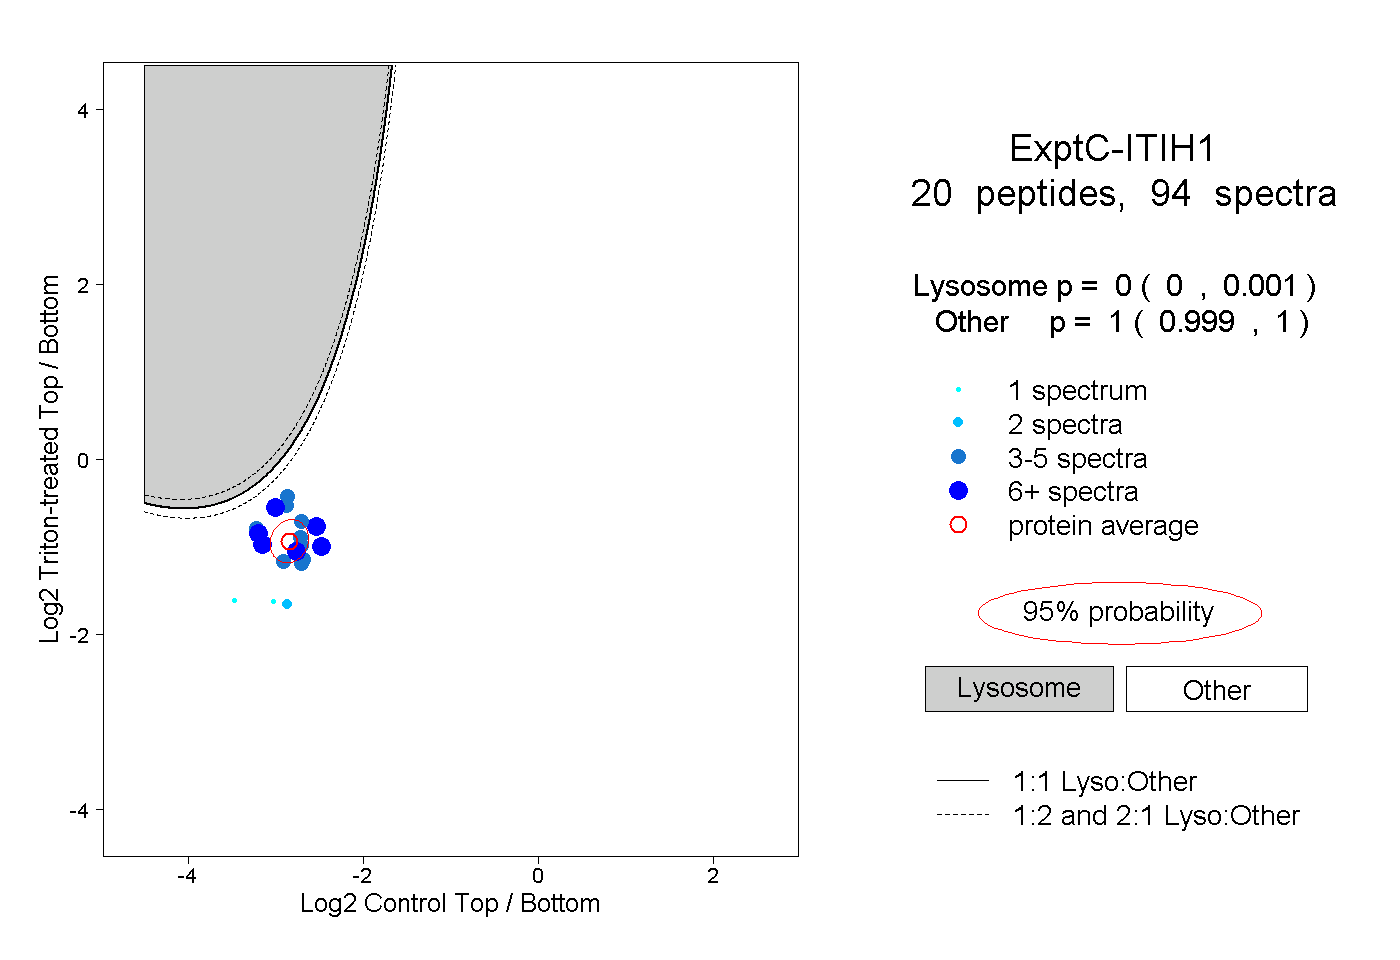 |
0.000 0.000 | 0.001 |
1.000 0.999 | 1.000 |
||||||||
| Plot | Lyso | Other | |||||||||||
| Expt D |
6 peptides |
7 spectra |
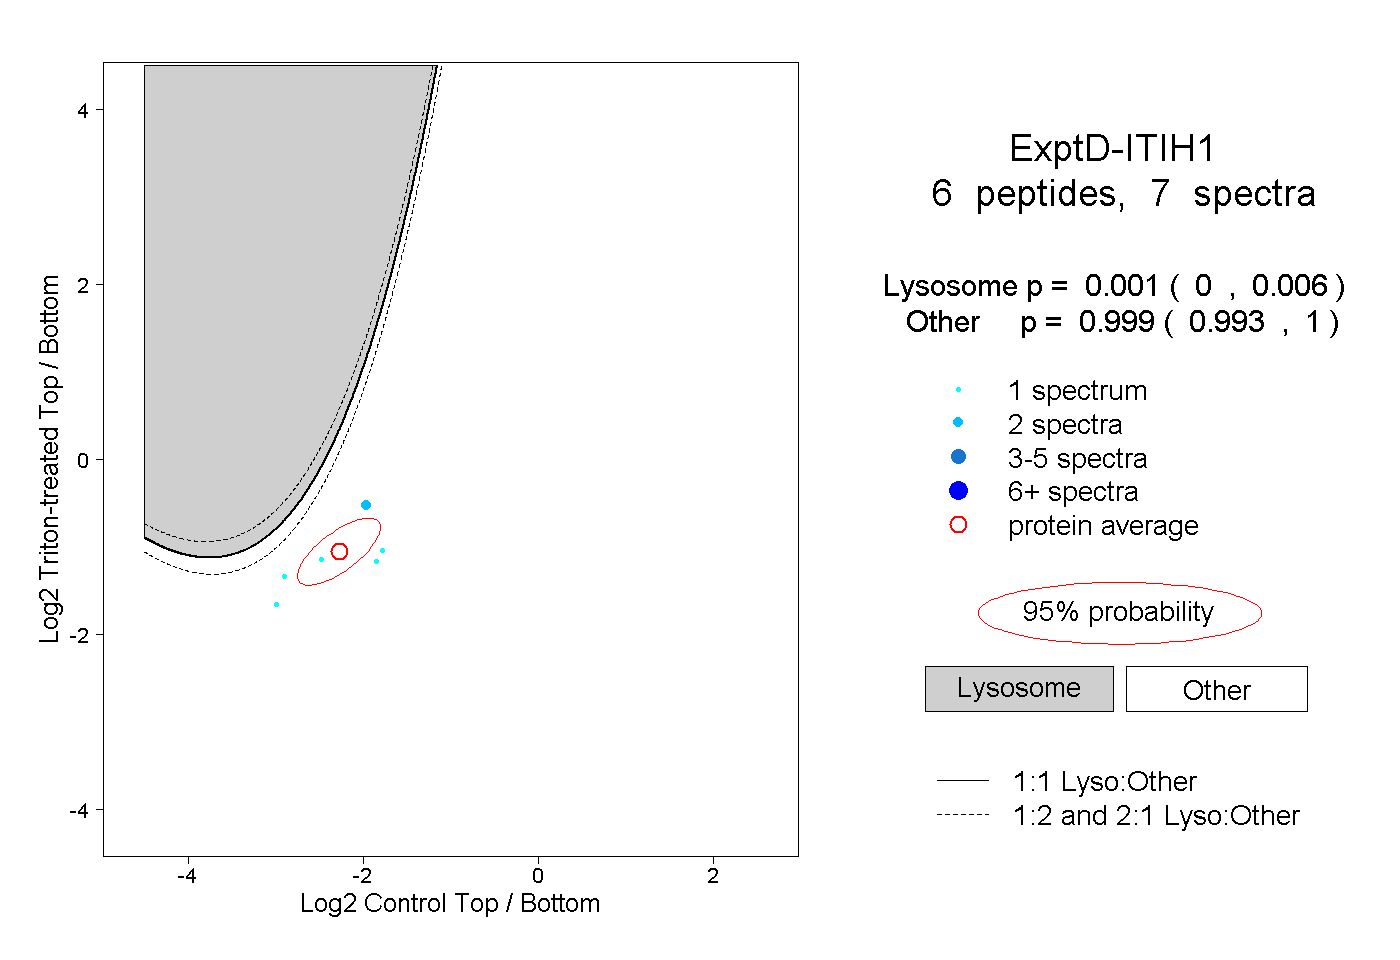 |
0.001 0.000 | 0.006 |
0.999 0.993 | 1.000 |