 9
9peptides
spectra
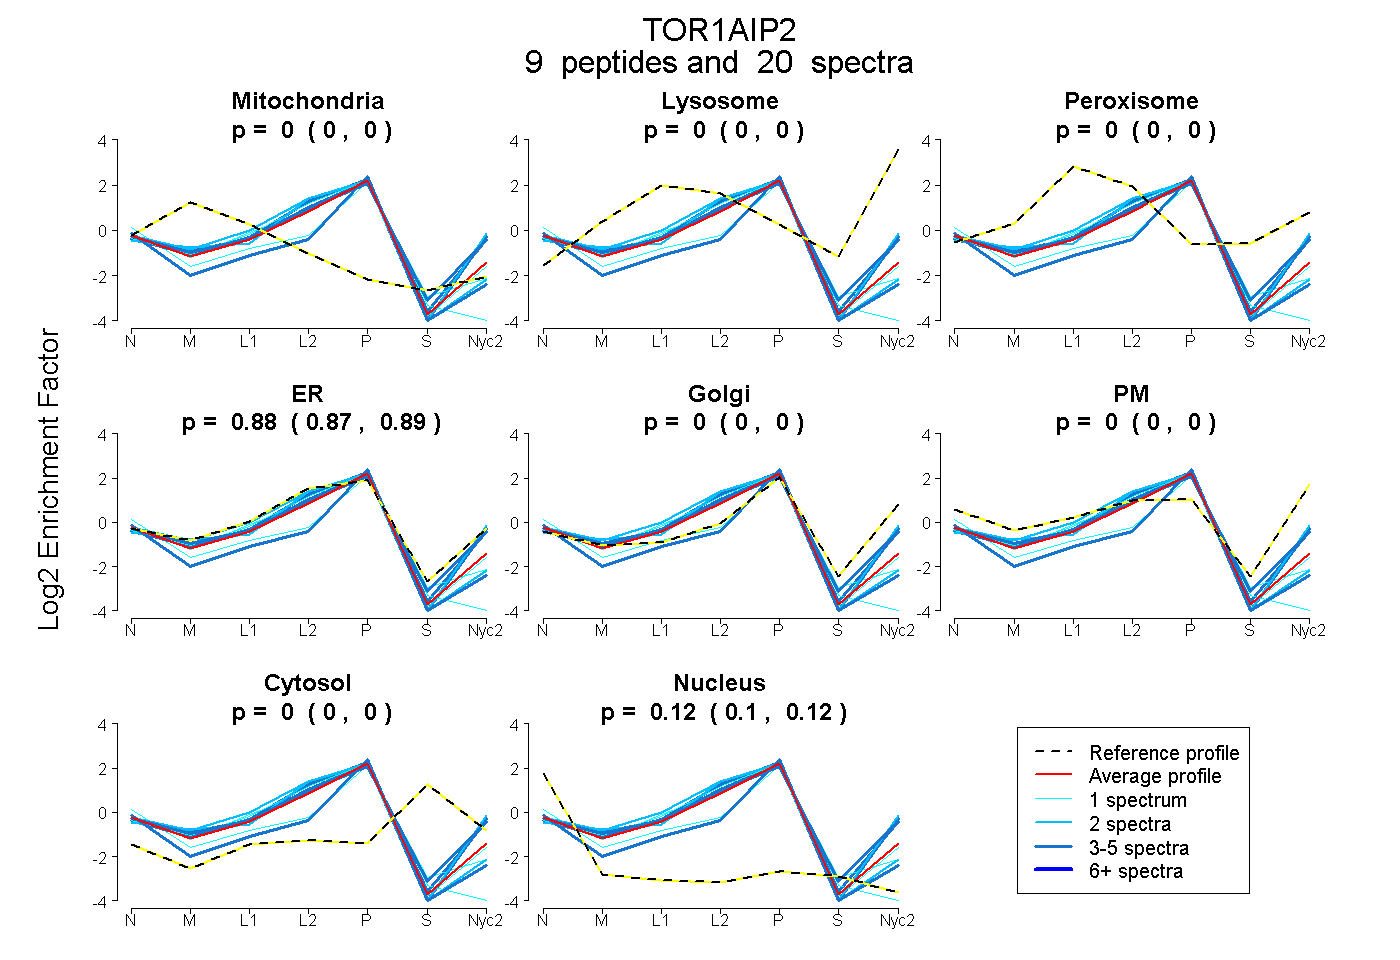
0.000 | 0.000
0.000 | 0.000
0.000 | 0.000
0.873 | 0.894
0.000 | 0.000
0.000 | 0.000
0.000 | 0.000
0.104 | 0.125
2peptides
spectra
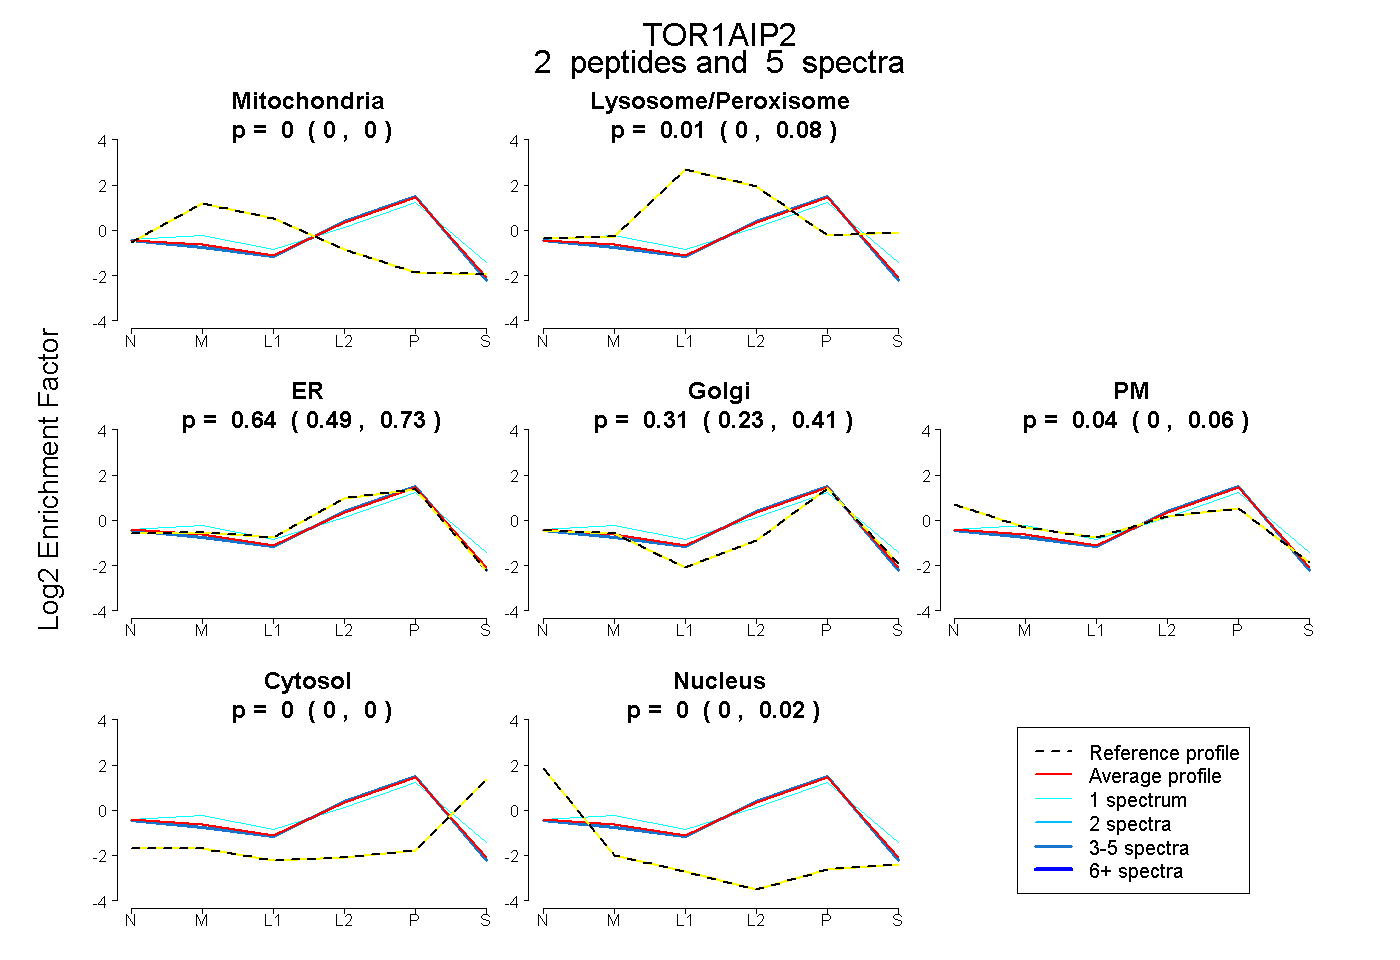
0.000 | 0.000
0.000 | 0.080
0.487 | 0.730
0.231 | 0.412
0.000 | 0.057
0.000 | 0.002
0.000 | 0.021
8peptides
spectra
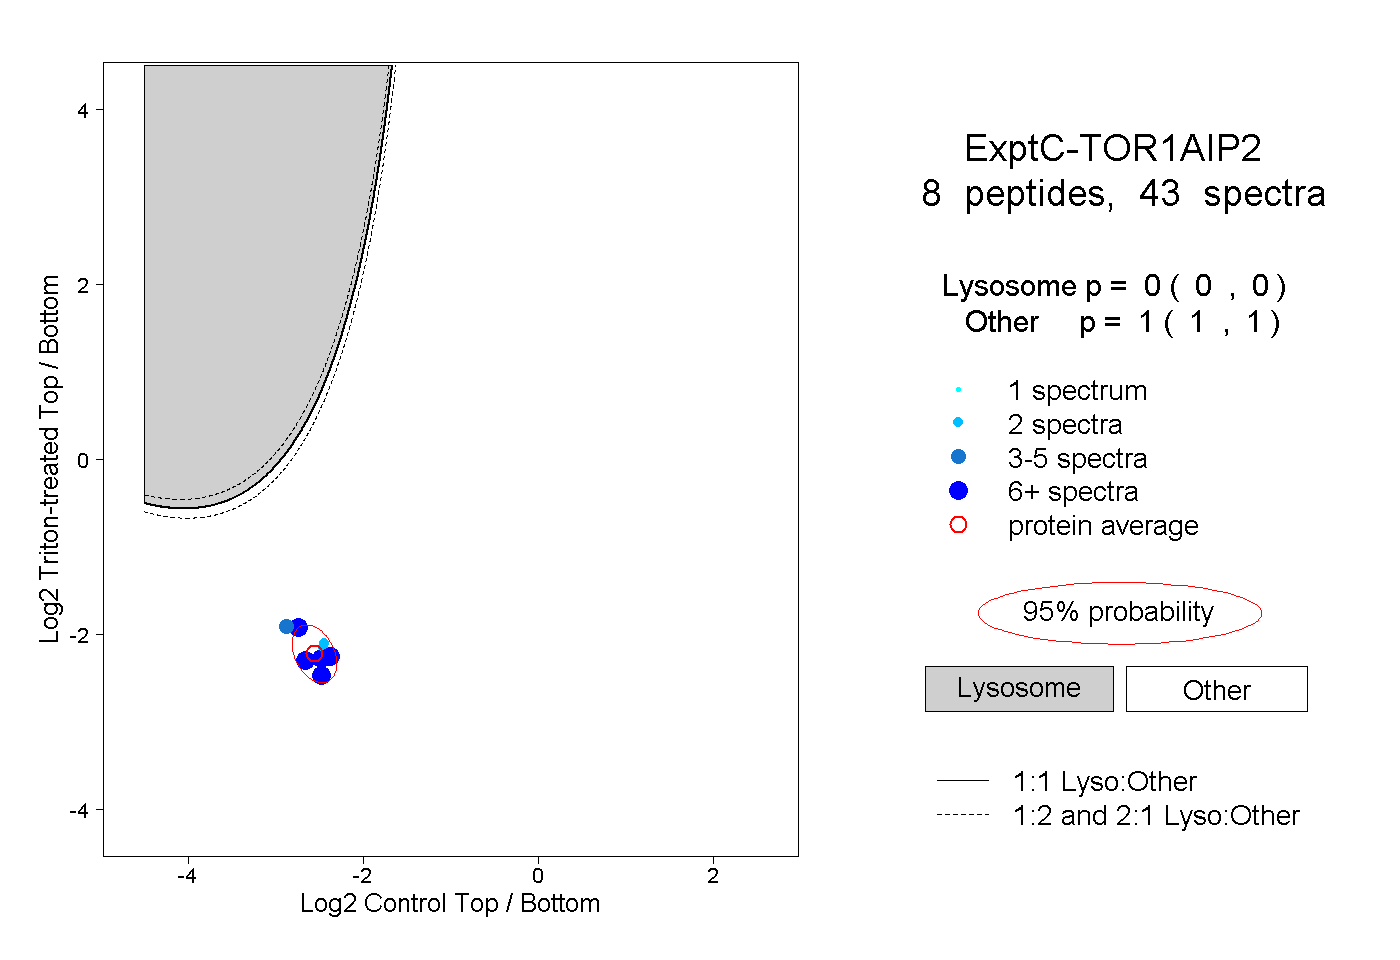
0.000 | 0.000
1.000 | 1.000
3peptides
spectra

0.000 | 0.000
1.000 | 1.000