TOR1AIP2
[ENSRNOP00000039176]
Main page
| | | Plot |
Mito |
Lyso |
|
Perox |
ER |
Golgi |
PM |
Cytosol |
Nucleus |
|
| Expt A |
 9
9
peptides |
20
spectra |
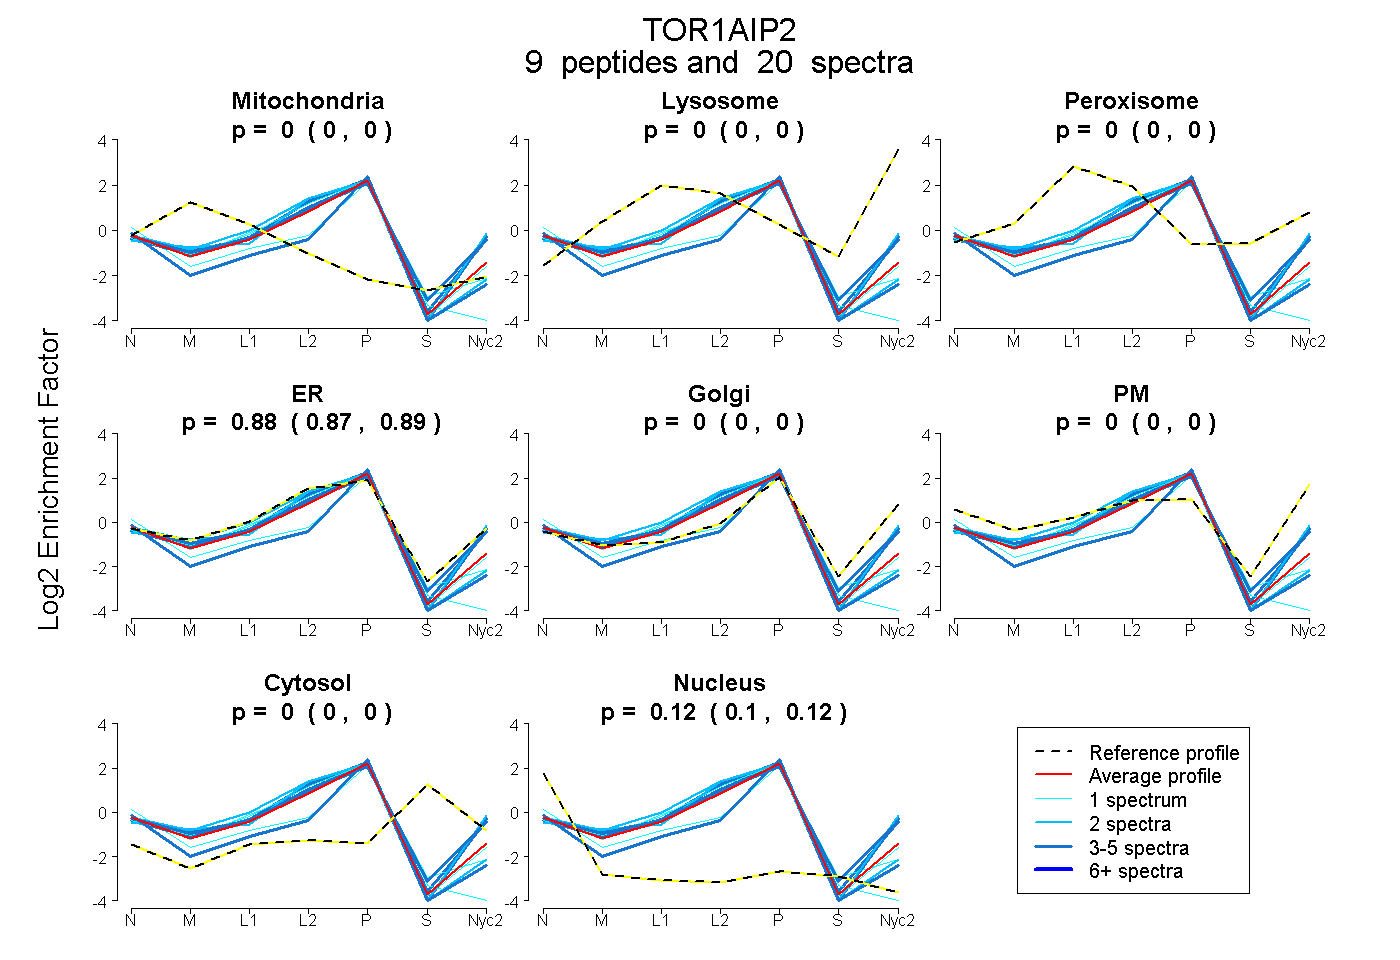 |
0.000
0.000 | 0.000 |
0.000
0.000 | 0.000 |
|
0.000
0.000 | 0.000 |
0.885
0.873 | 0.894 |
0.000
0.000 | 0.000 |
0.000
0.000 | 0.000 |
0.000
0.000 | 0.000 |
0.115
0.104 | 0.125 |
|
| | | Plot |
Mito |
|
Lyso or Perox |
|
ER |
Golgi |
PM |
Cytosol |
Nucleus |
|
| Expt B |
2
peptides |
5
spectra |
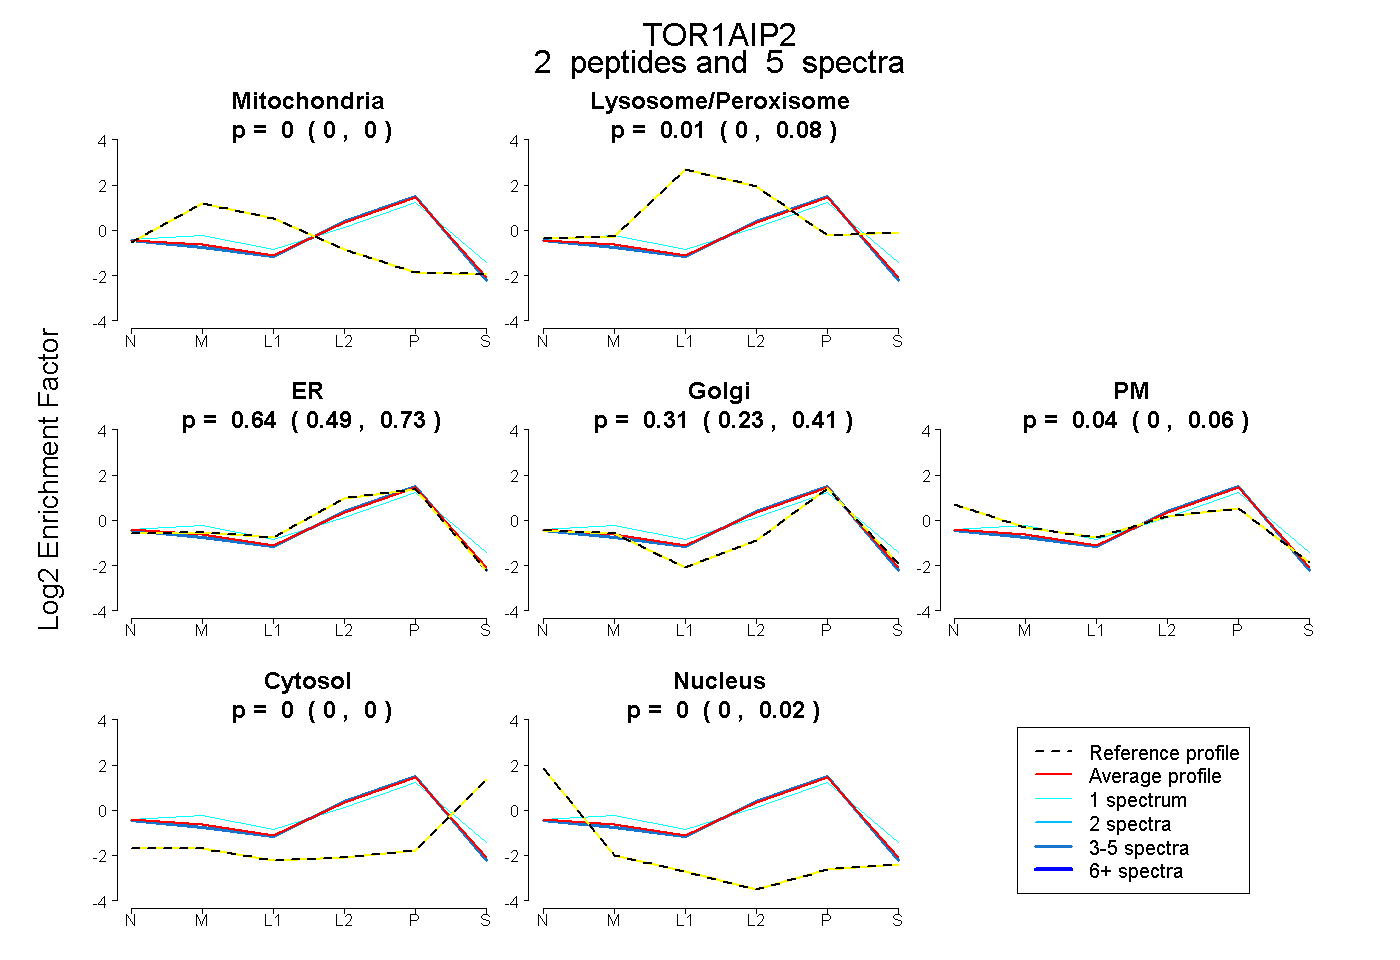 |
0.000
0.000 | 0.000 |
|
0.009
0.000 | 0.080 |
|
0.641
0.487 | 0.730 |
0.314
0.231 | 0.412 |
0.036
0.000 | 0.057 |
0.000
0.000 | 0.002 |
0.000
0.000 | 0.021 |
|
| | | Plot |
|
Lyso |
|
|
|
|
|
|
|
Other |
| Expt C |
8
peptides |
43
spectra |
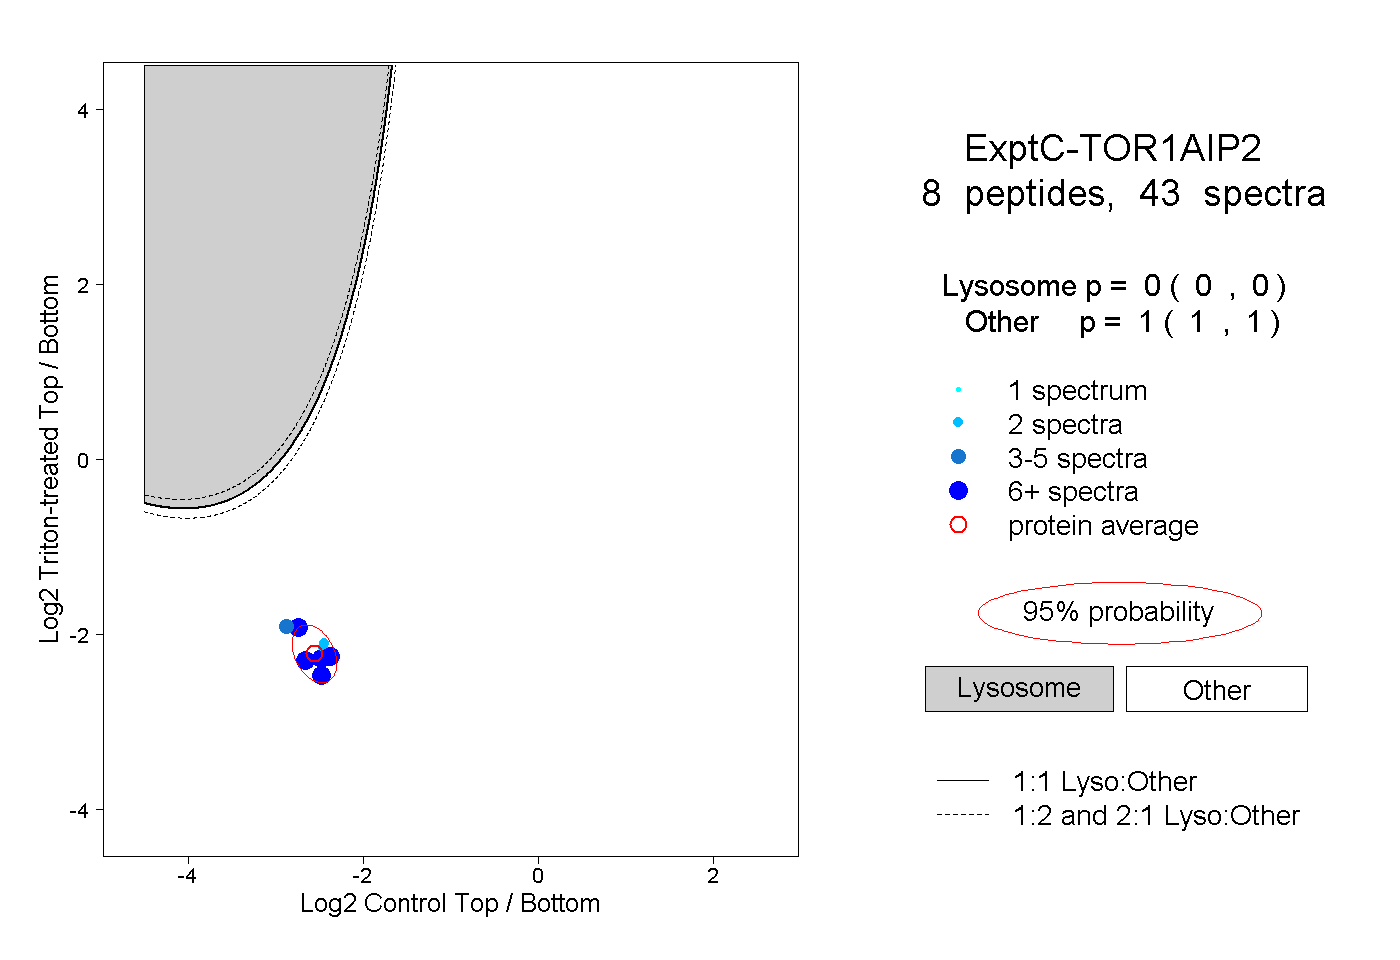 |
|
0.000
0.000 | 0.000 |
|
|
|
|
|
|
|
1.000
1.000 | 1.000 |
| 7 spectra, ISHLVLPVQPVK |
|
0.000 |
|
|
|
|
|
|
|
1.000 |
| 7 spectra, ALQDSDTVK |
|
0.000 |
|
|
|
|
|
|
|
1.000 |
| 3 spectra, LPVTEAER |
|
0.000 |
|
|
|
|
|
|
|
1.000 |
| 2 spectra, LSGLWSR |
|
0.000 |
|
|
|
|
|
|
|
1.000 |
| 6 spectra, FPGQSAFLWQR |
|
0.000 |
|
|
|
|
|
|
|
1.000 |
| 10 spectra, YCDHENAAFK |
|
0.000 |
|
|
|
|
|
|
|
1.000 |
| 2 spectra, DLLWAK |
|
0.000 |
|
|
|
|
|
|
|
1.000 |
| 6 spectra, VTAVSIDGAER |
|
0.000 |
|
|
|
|
|
|
|
1.000 |
| | | Plot |
|
Lyso |
|
|
|
|
|
|
|
Other |
| Expt D |
3
peptides |
4
spectra |
 |
|
0.000
0.000 | 0.000 |
|
|
|
|
|
|
|
1.000
1.000 | 1.000 |