 9
9peptides
spectra
0.000 | 0.000
0.000 | 0.000
0.000 | 0.000
0.873 | 0.894
0.000 | 0.000
0.000 | 0.000
0.000 | 0.000
0.104 | 0.125
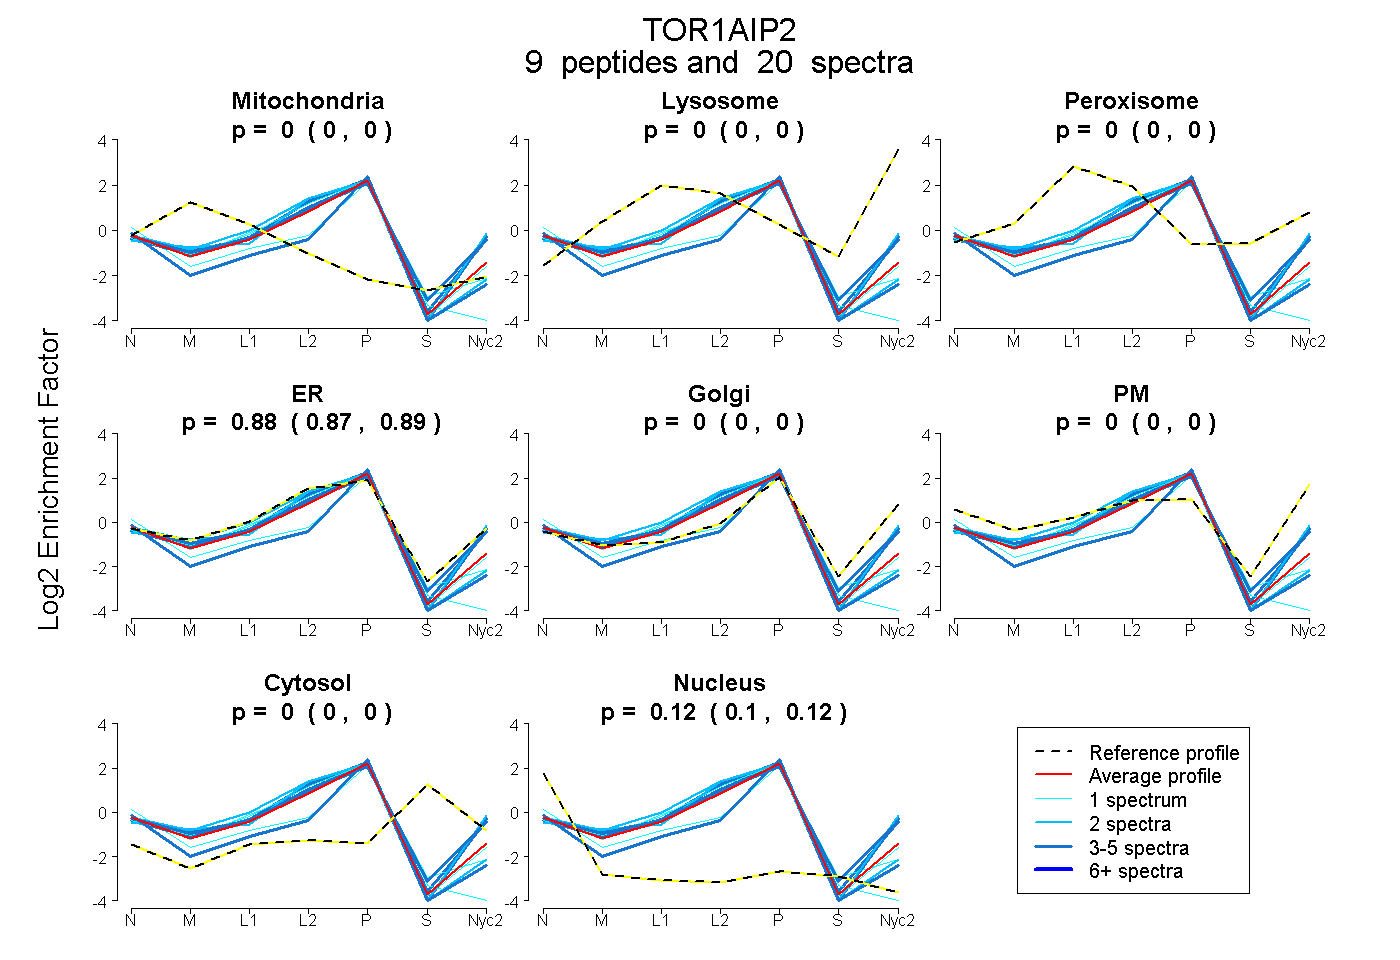
| Plot | Mito | Lyso | Perox | ER | Golgi | PM | Cytosol | Nucleus | |||||
| Expt A |
9 peptides |
20 spectra |
|
0.000 0.000 | 0.000 |
0.000 0.000 | 0.000 |
0.000 0.000 | 0.000 |
0.885 0.873 | 0.894 |
0.000 0.000 | 0.000 |
0.000 0.000 | 0.000 |
0.000 0.000 | 0.000 |
0.115 0.104 | 0.125 |
| 1 spectrum, AAVVHHFESLPAGSTLIFYK | 0.000 | 0.000 | 0.000 | 0.887 | 0.000 | 0.000 | 0.000 | 0.113 | ||
| 2 spectra, ISHLVLPVQPVK | 0.000 | 0.000 | 0.000 | 0.910 | 0.000 | 0.000 | 0.000 | 0.090 | ||
| 1 spectrum, LPVTEAER | 0.000 | 0.000 | 0.000 | 0.805 | 0.000 | 0.000 | 0.000 | 0.195 | ||
| 1 spectrum, EDHHEIGAK | 0.000 | 0.000 | 0.000 | 0.723 | 0.017 | 0.000 | 0.000 | 0.260 | ||
| 2 spectra, LSGLWSR | 0.000 | 0.000 | 0.000 | 0.846 | 0.154 | 0.000 | 0.000 | 0.000 | ||
| 3 spectra, FPGQSAFLWQR | 0.000 | 0.000 | 0.000 | 0.881 | 0.106 | 0.000 | 0.000 | 0.012 | ||
| 3 spectra, DLLWAK | 0.000 | 0.000 | 0.000 | 0.811 | 0.158 | 0.000 | 0.000 | 0.031 | ||
| 4 spectra, SPSSQDTEQR | 0.000 | 0.000 | 0.000 | 0.703 | 0.010 | 0.000 | 0.000 | 0.287 | ||
| 3 spectra, VTAVSIDGAER | 0.000 | 0.000 | 0.000 | 0.777 | 0.182 | 0.000 | 0.000 | 0.041 |
| Plot | Mito | Lyso or Perox | ER | Golgi | PM | Cytosol | Nucleus | ||||||
| Expt B |
2 peptides |
5 spectra |
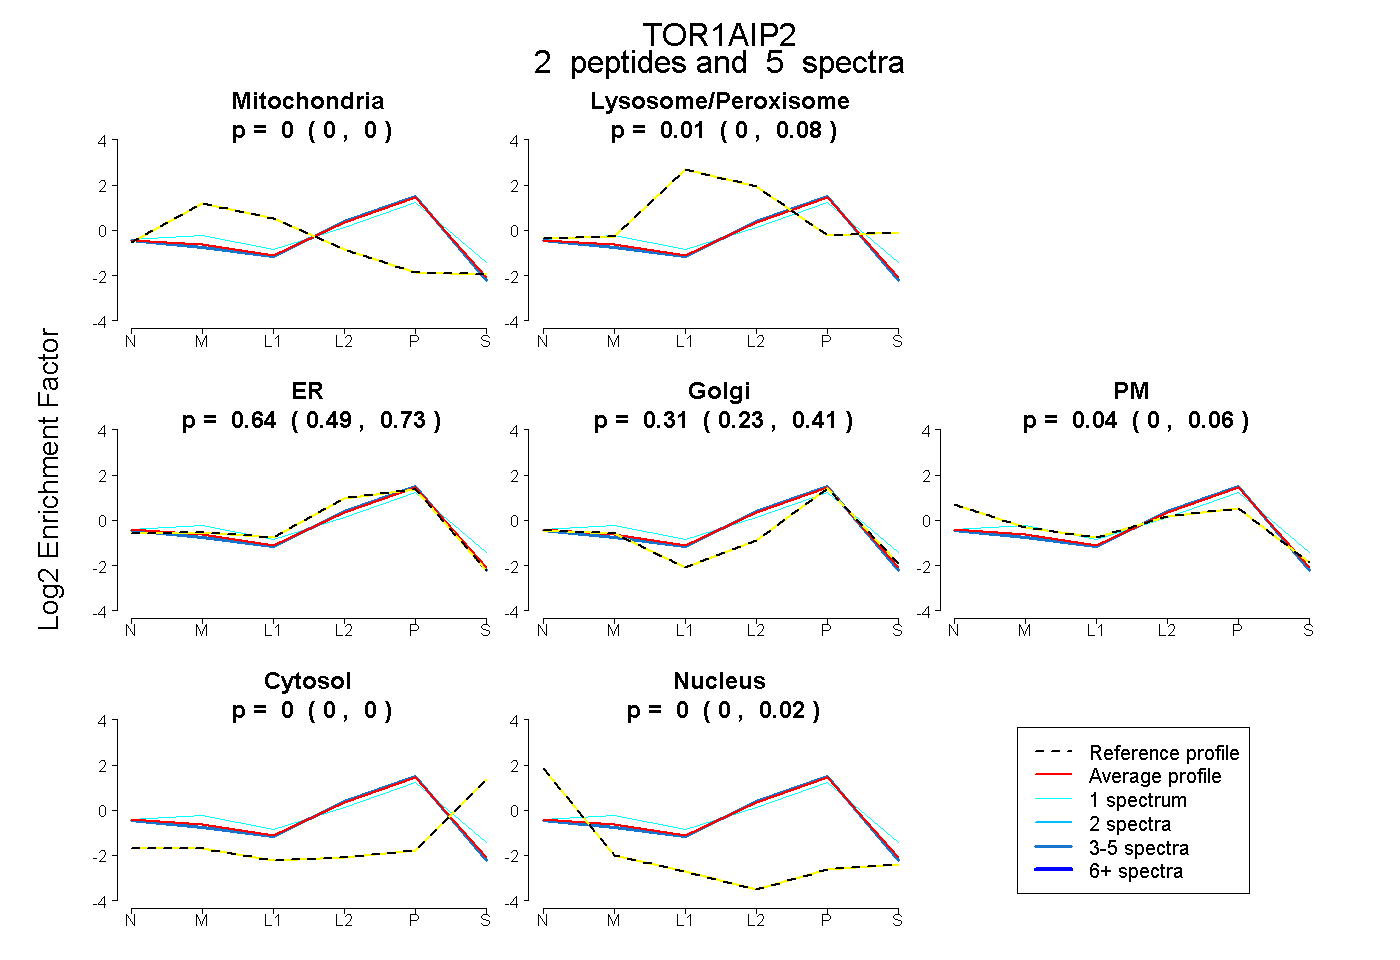 |
0.000 0.000 | 0.000 |
0.009 0.000 | 0.080 |
0.641 0.487 | 0.730 |
0.314 0.231 | 0.412 |
0.036 0.000 | 0.057 |
0.000 0.000 | 0.002 |
0.000 0.000 | 0.021 |
|||
| Plot | Lyso | Other | |||||||||||
| Expt C |
8 peptides |
43 spectra |
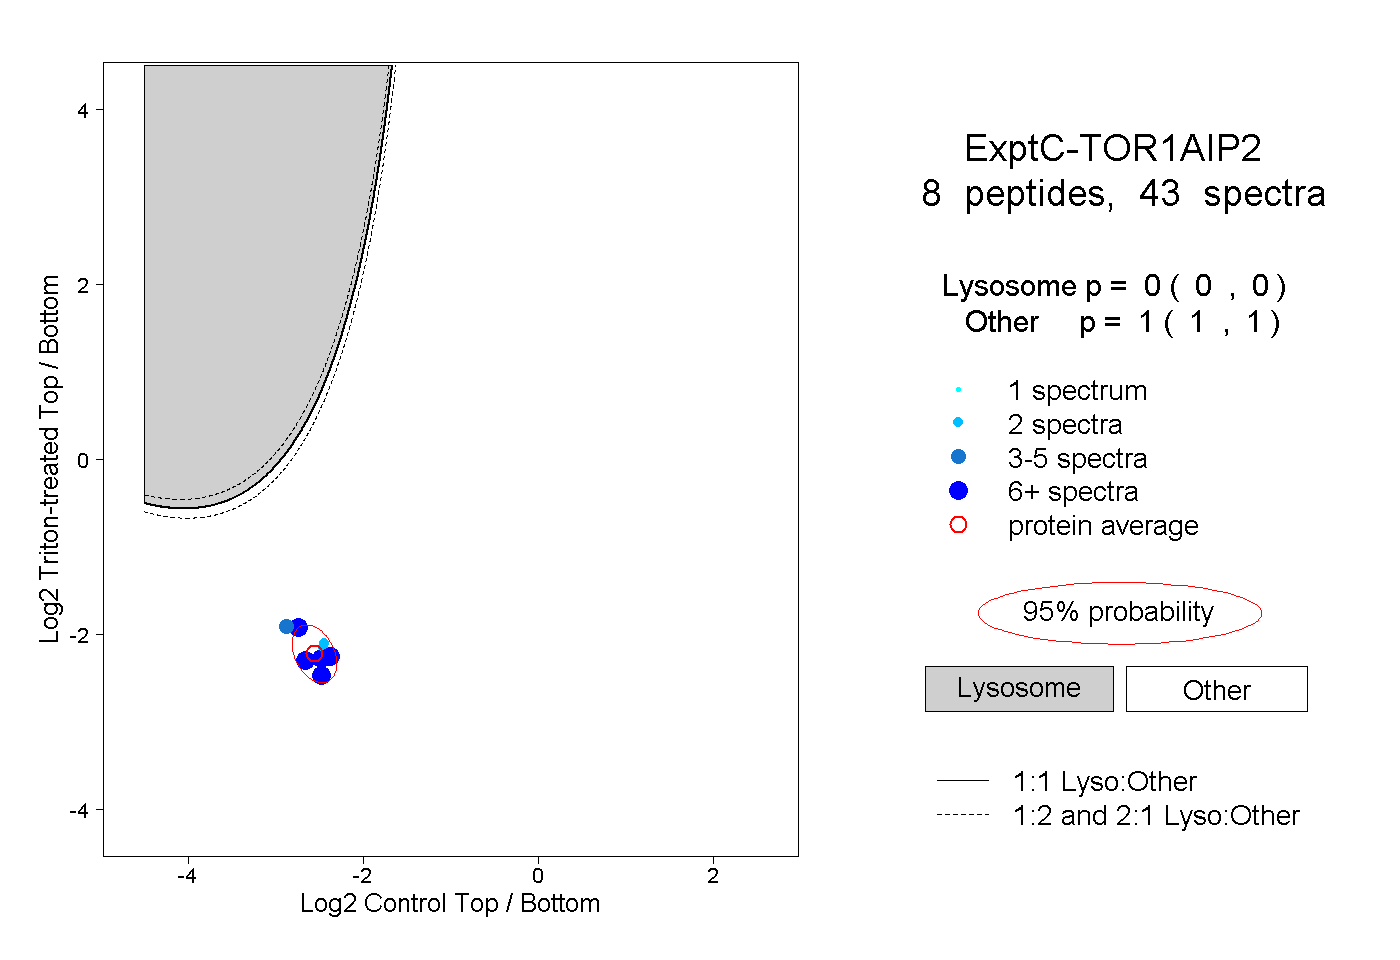 |
0.000 0.000 | 0.000 |
1.000 1.000 | 1.000 |
||||||||
| Plot | Lyso | Other | |||||||||||
| Expt D |
3 peptides |
4 spectra |
 |
0.000 0.000 | 0.000 |
1.000 1.000 | 1.000 |