 13
13peptides
spectra

0.000 | 0.000
0.981 | 1.000
0.000 | 0.000
0.000 | 0.000
0.000 | 0.000
0.000 | 0.000
0.000 | 0.017
0.000 | 0.000
4peptides
spectra

0.000 | 0.104
0.871 | 1.000
0.000 | 0.017
0.000 | 0.025
0.000 | 0.035
0.000 | 0.000
0.000 | 0.028
23peptides
spectra
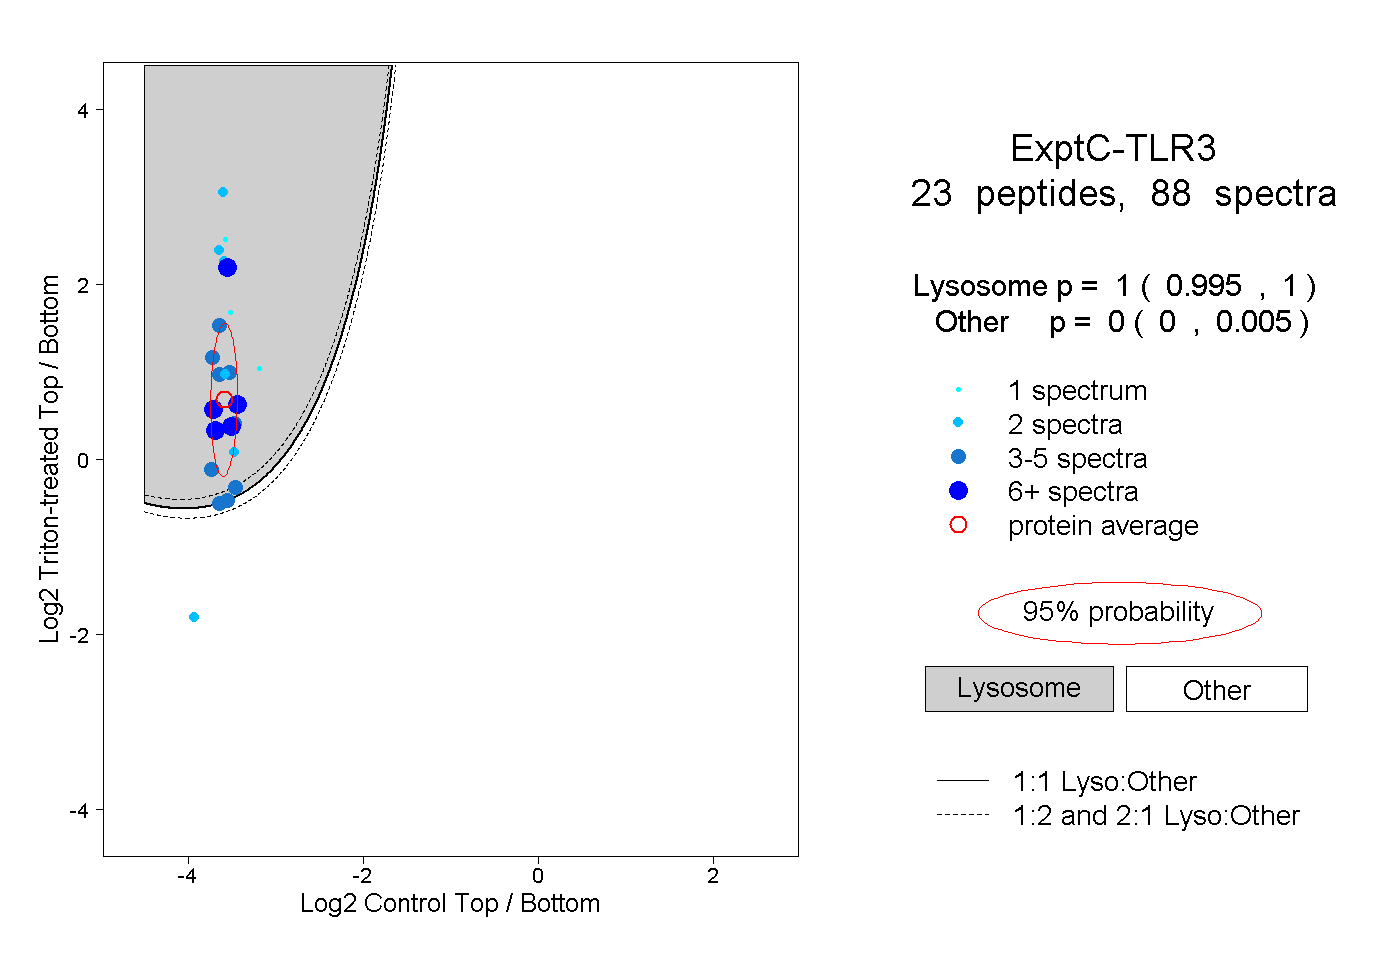
0.995 | 1.000
0.000 | 0.005
3peptides
spectra

0.003 | 1.000
0.000 | 0.997