 36
36peptides
spectra
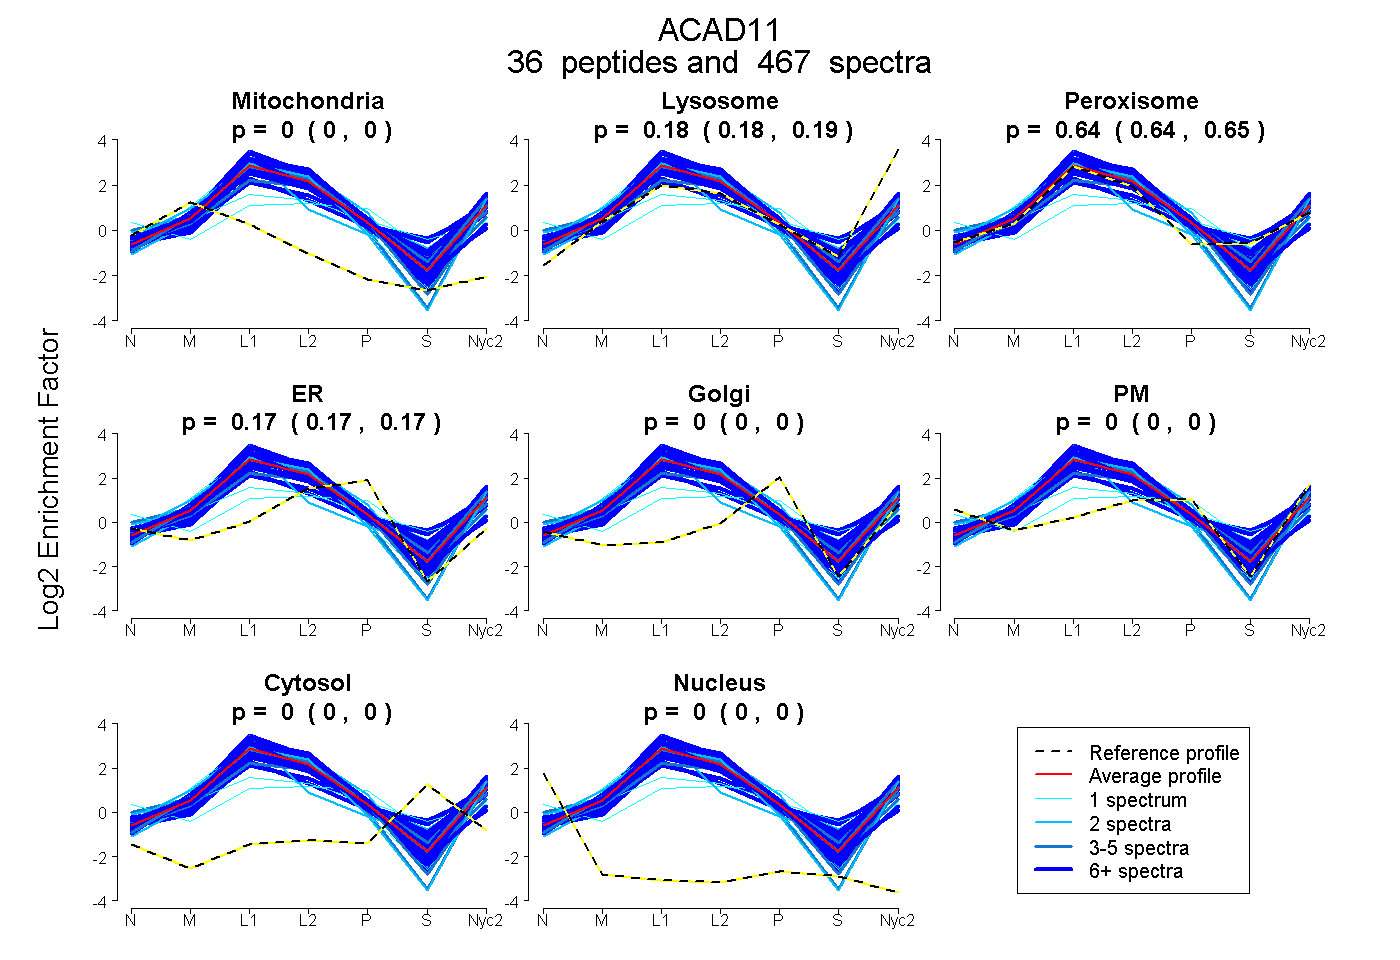
0.000 | 0.000
0.183 | 0.186
0.643 | 0.646
0.169 | 0.172
0.000 | 0.000
0.000 | 0.000
0.000 | 0.000
0.000 | 0.000
30peptides
spectra
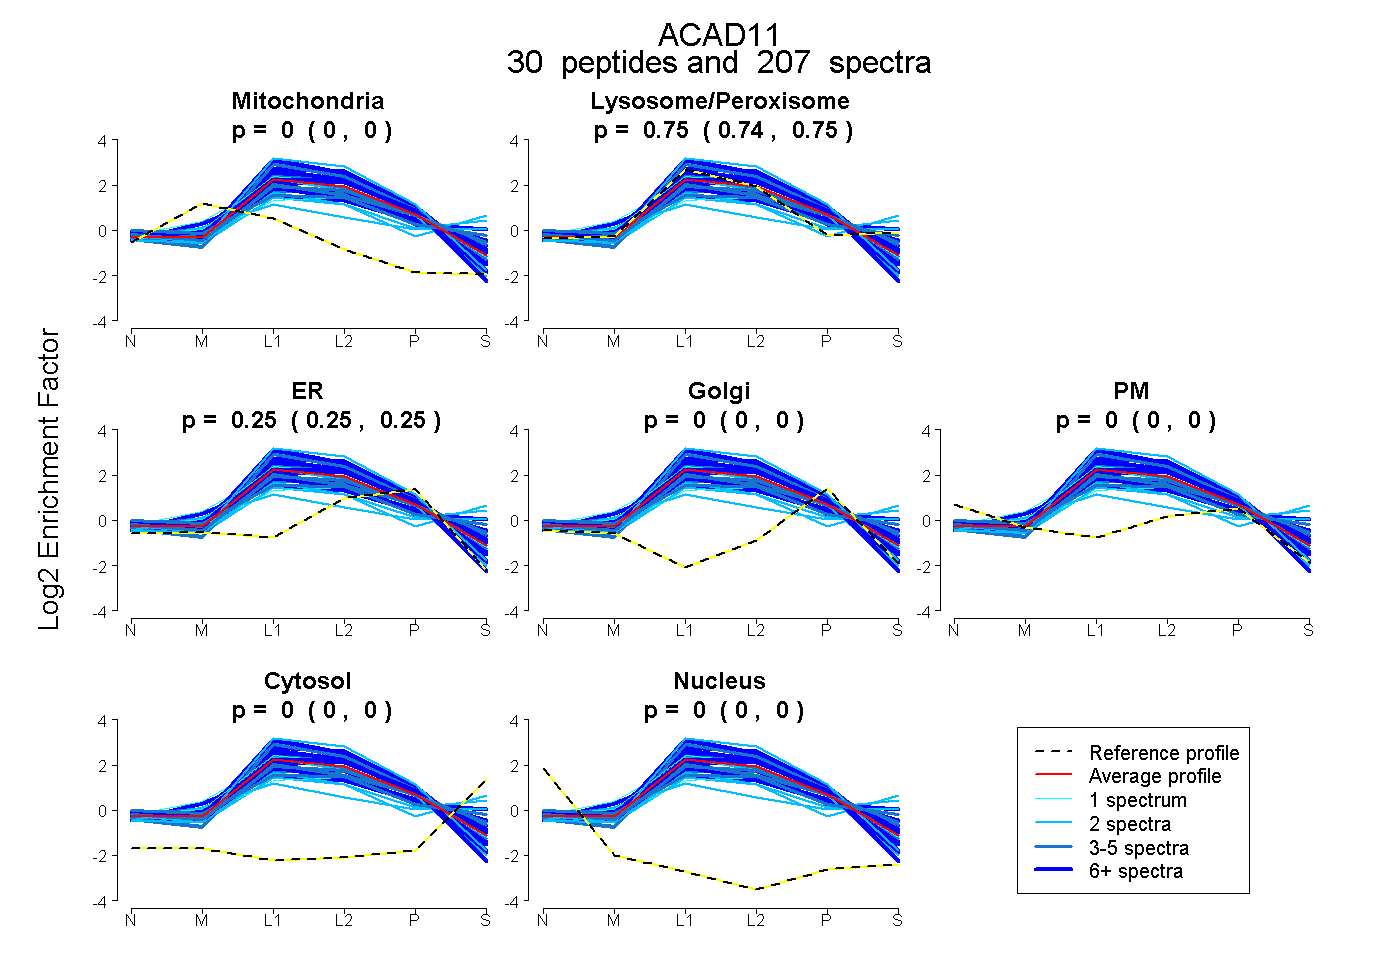
0.000 | 0.000
0.745 | 0.751
0.249 | 0.254
0.000 | 0.000
0.000 | 0.000
0.000 | 0.000
0.000 | 0.000
37peptides
spectra
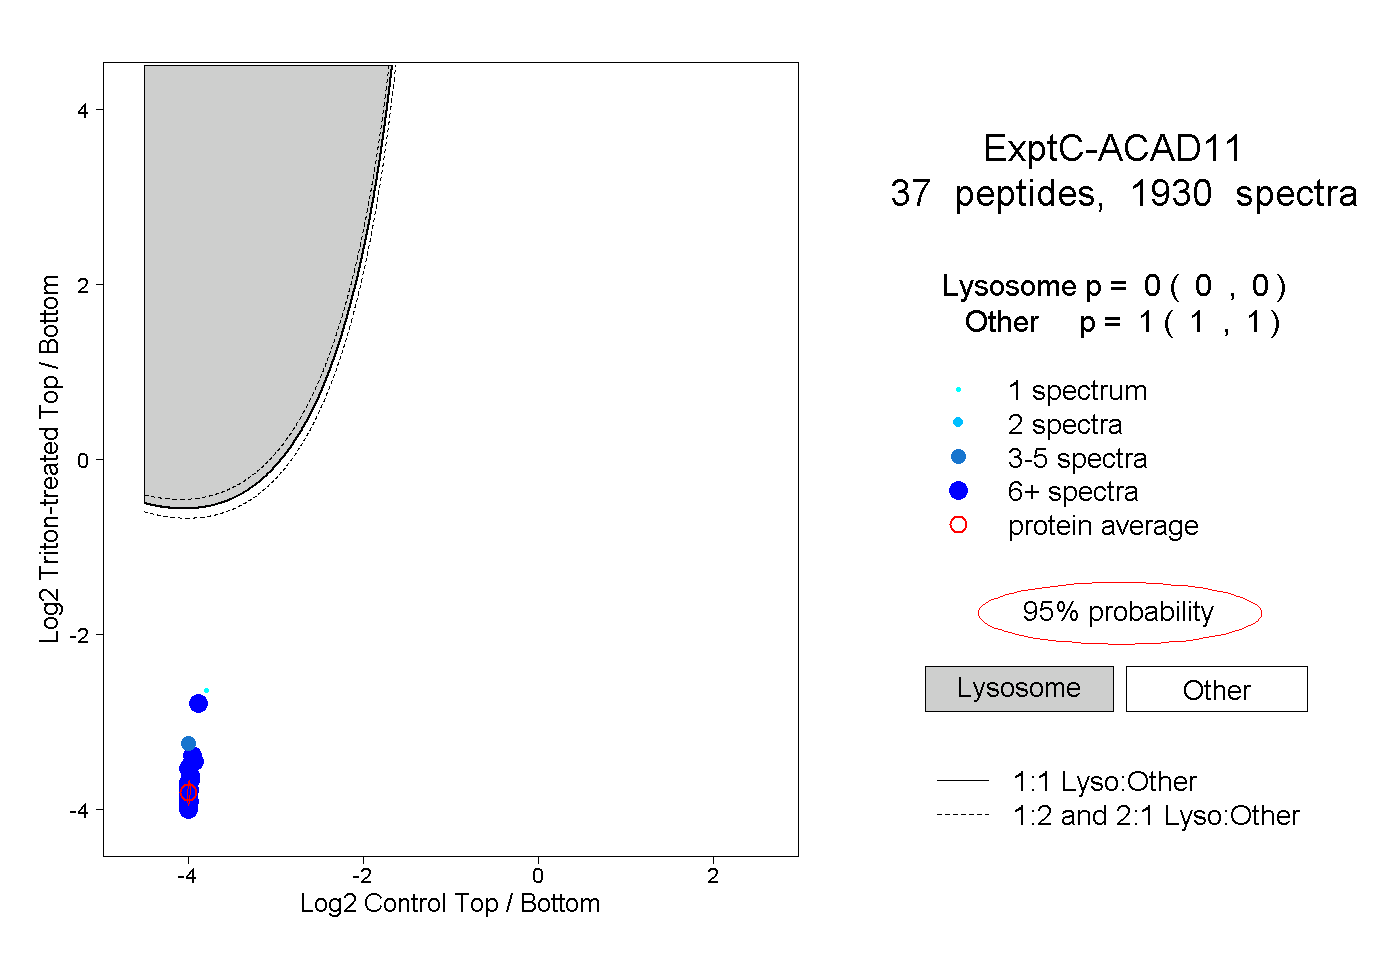
0.000 | 0.000
1.000 | 1.000
24peptides
spectra
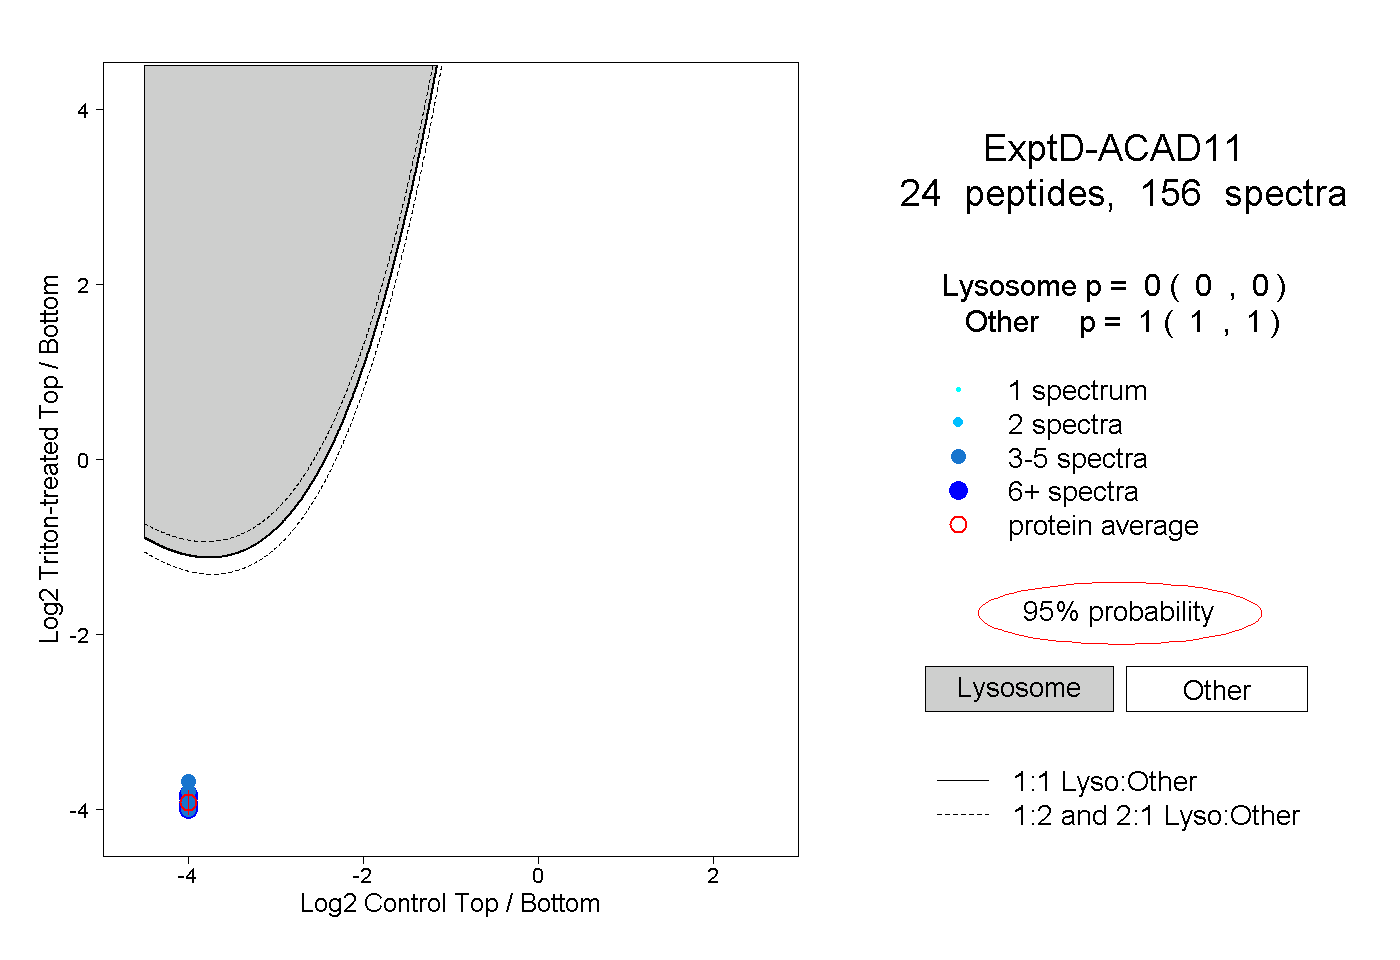
0.000 | 0.000
1.000 | 1.000