 8
8peptides
spectra
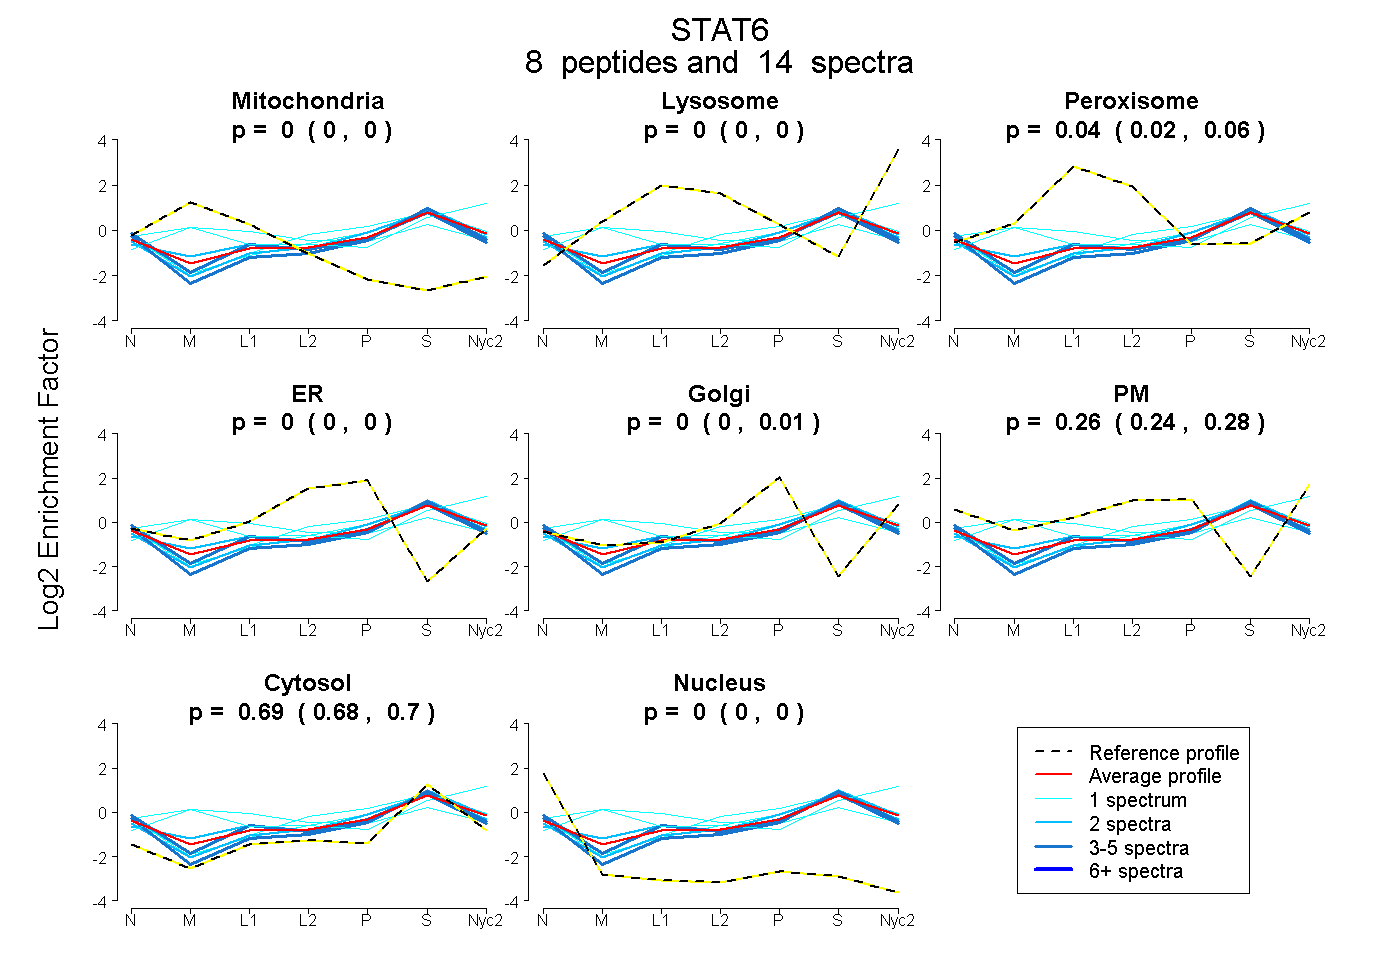
0.000 | 0.000
0.000 | 0.000
0.025 | 0.061
0.000 | 0.000
0.000 | 0.007
0.245 | 0.277
0.675 | 0.703
0.000 | 0.000
1peptide
spectrum
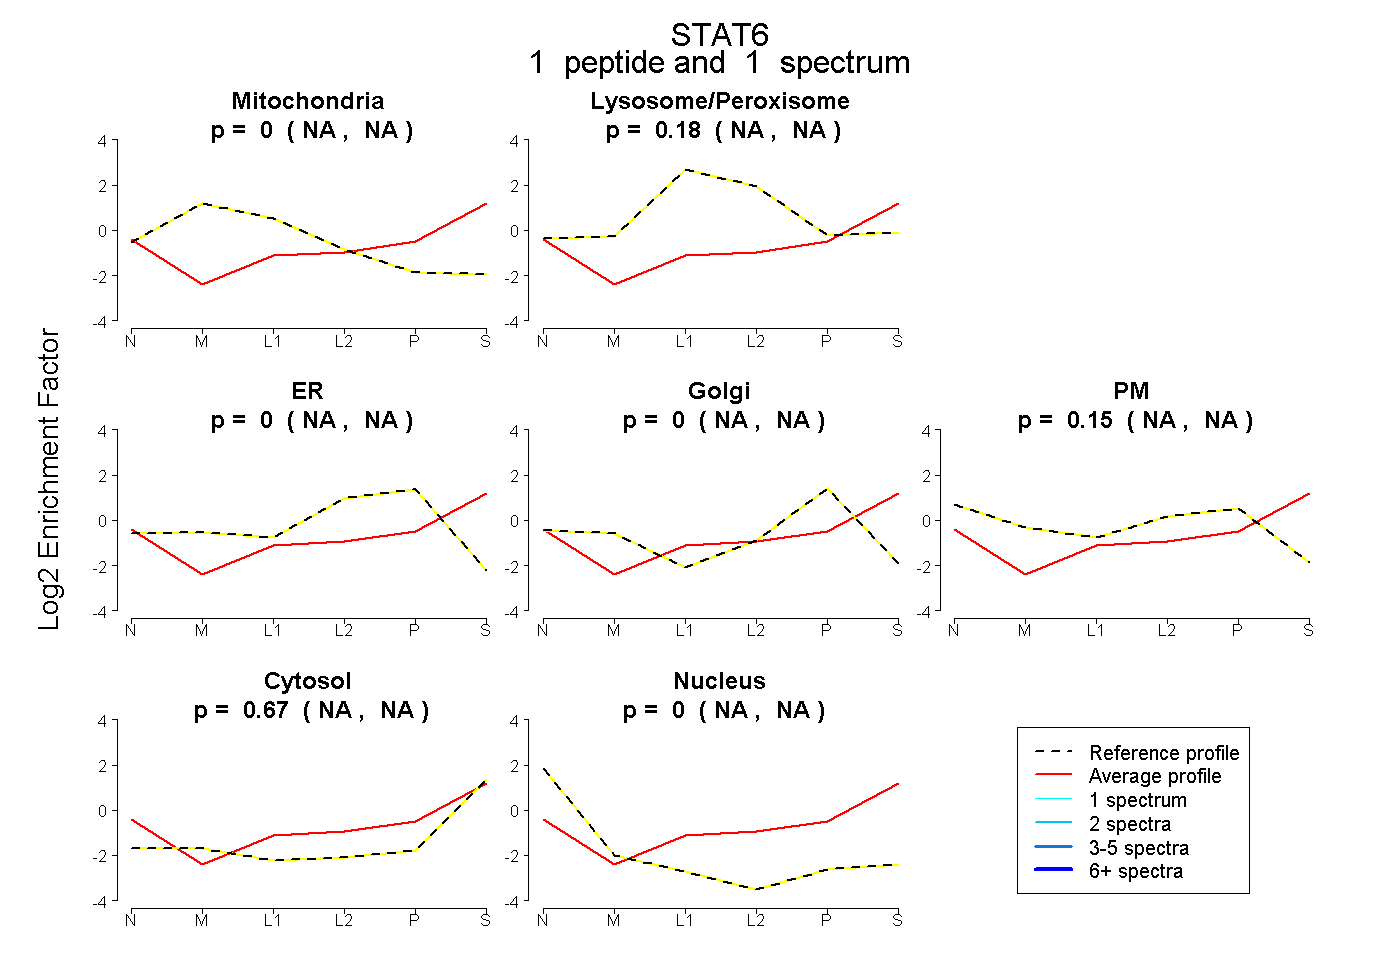
NA | NA
NA | NA
NA | NA
NA | NA
NA | NA
NA | NA
NA | NA
7peptides
spectra
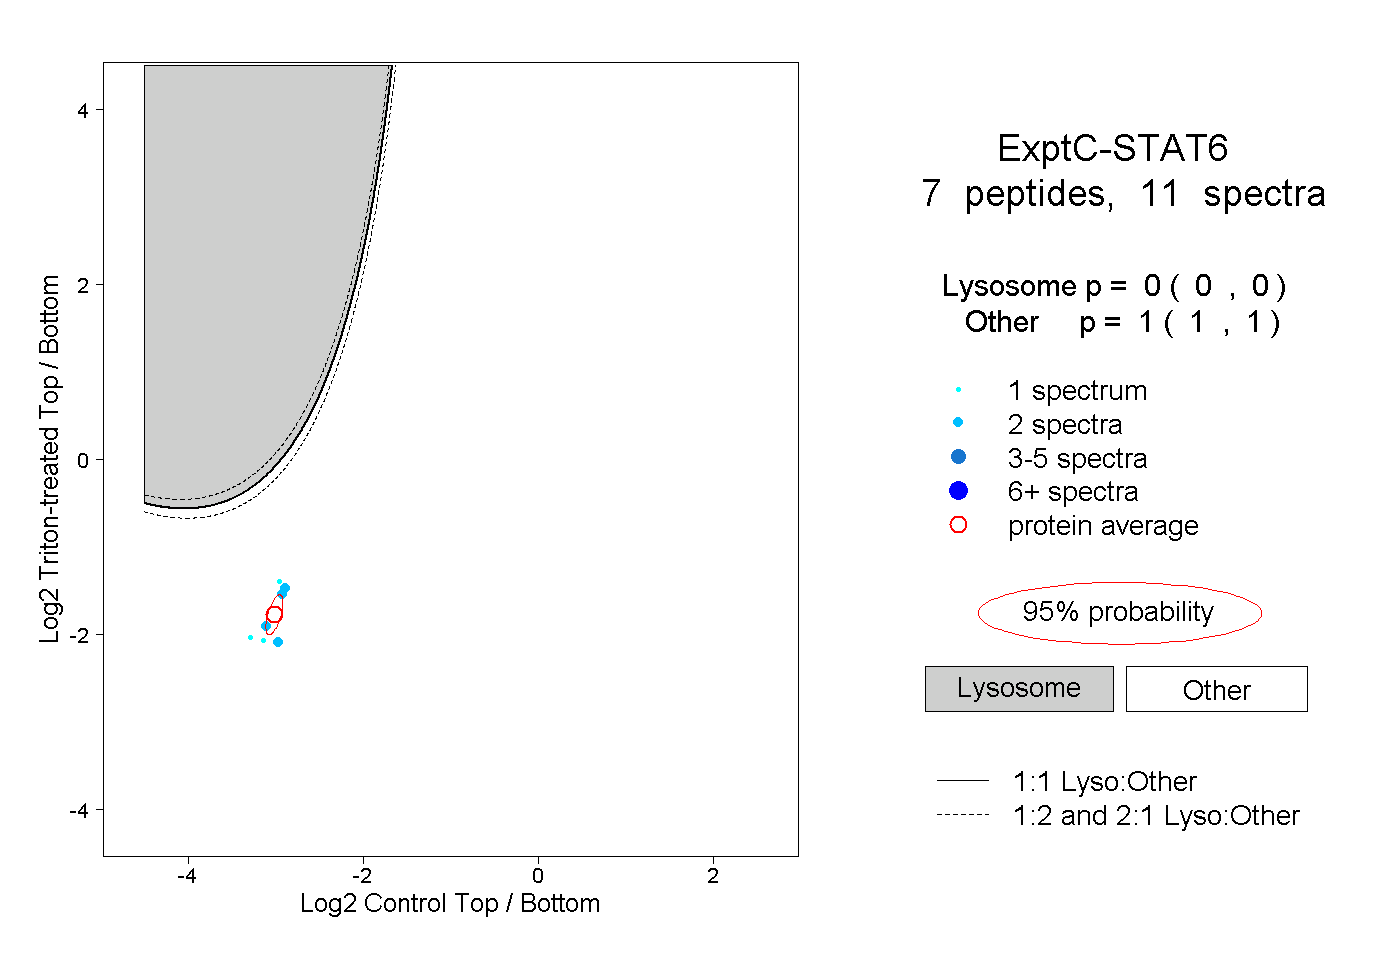
0.000 | 0.000
1.000 | 1.000