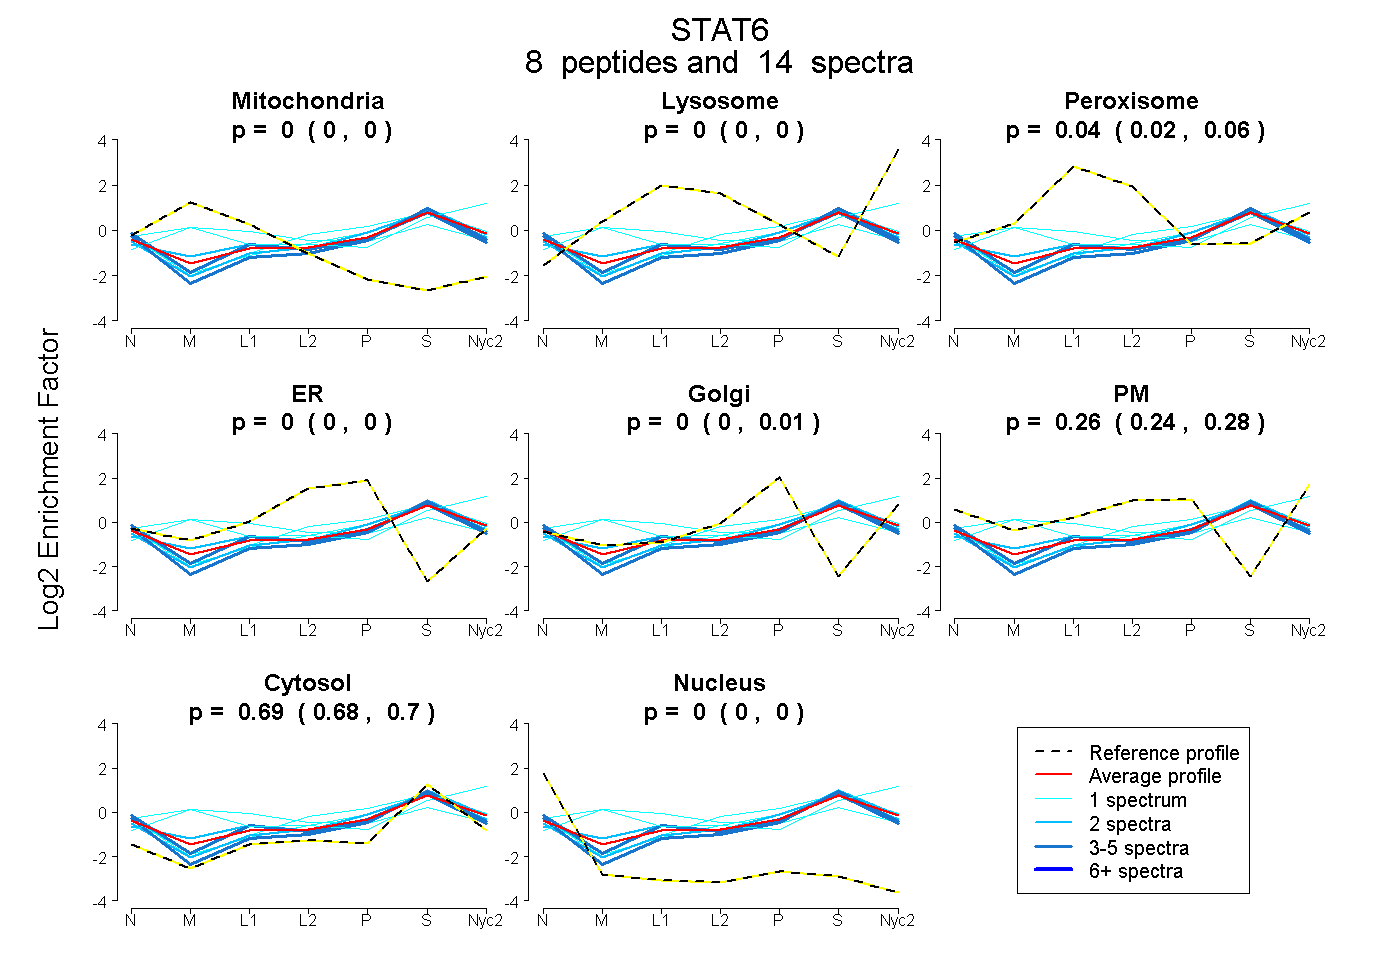
 8
8peptides
spectra
0.000 | 0.000
0.000 | 0.000
0.025 | 0.061
0.000 | 0.000
0.000 | 0.007
0.245 | 0.277
0.675 | 0.703
0.000 | 0.000
| Plot | Mito | Lyso | Perox | ER | Golgi | PM | Cytosol | Nucleus | |||||
| Expt A |
8 peptides |
14 spectra |
|
0.000 0.000 | 0.000 |
0.000 0.000 | 0.000 |
0.044 0.025 | 0.061 |
0.000 0.000 | 0.000 |
0.000 0.000 | 0.007 |
0.265 0.245 | 0.277 |
0.691 0.675 | 0.703 |
0.000 0.000 | 0.000 |
| 1 spectrum, SHYKPEQMGK | 0.122 | 0.379 | 0.000 | 0.000 | 0.000 | 0.002 | 0.497 | 0.000 | ||
| 3 spectra, LYVDFPQHLR | 0.000 | 0.000 | 0.075 | 0.003 | 0.000 | 0.203 | 0.688 | 0.031 | ||
| 2 spectra, AVIEEFHHLPGPFHR | 0.000 | 0.000 | 0.169 | 0.000 | 0.205 | 0.000 | 0.626 | 0.000 | ||
| 1 spectrum, FTTALGR | 0.000 | 0.000 | 0.000 | 0.075 | 0.003 | 0.260 | 0.662 | 0.000 | ||
| 2 spectra, GLLPEHFLFLAQK | 0.000 | 0.000 | 0.000 | 0.000 | 0.000 | 0.234 | 0.766 | 0.000 | ||
| 1 spectrum, ADMVTEK | 0.000 | 0.000 | 0.000 | 0.000 | 0.049 | 0.246 | 0.705 | 0.000 | ||
| 1 spectrum, FSDSEIGGITIAHVIR | 0.222 | 0.000 | 0.247 | 0.000 | 0.062 | 0.074 | 0.396 | 0.000 | ||
| 3 spectra, LIIGFISK | 0.000 | 0.000 | 0.000 | 0.000 | 0.025 | 0.168 | 0.786 | 0.020 |
| Plot | Mito | Lyso or Perox | ER | Golgi | PM | Cytosol | Nucleus | ||||||
| Expt B |
1 peptide |
1 spectrum |
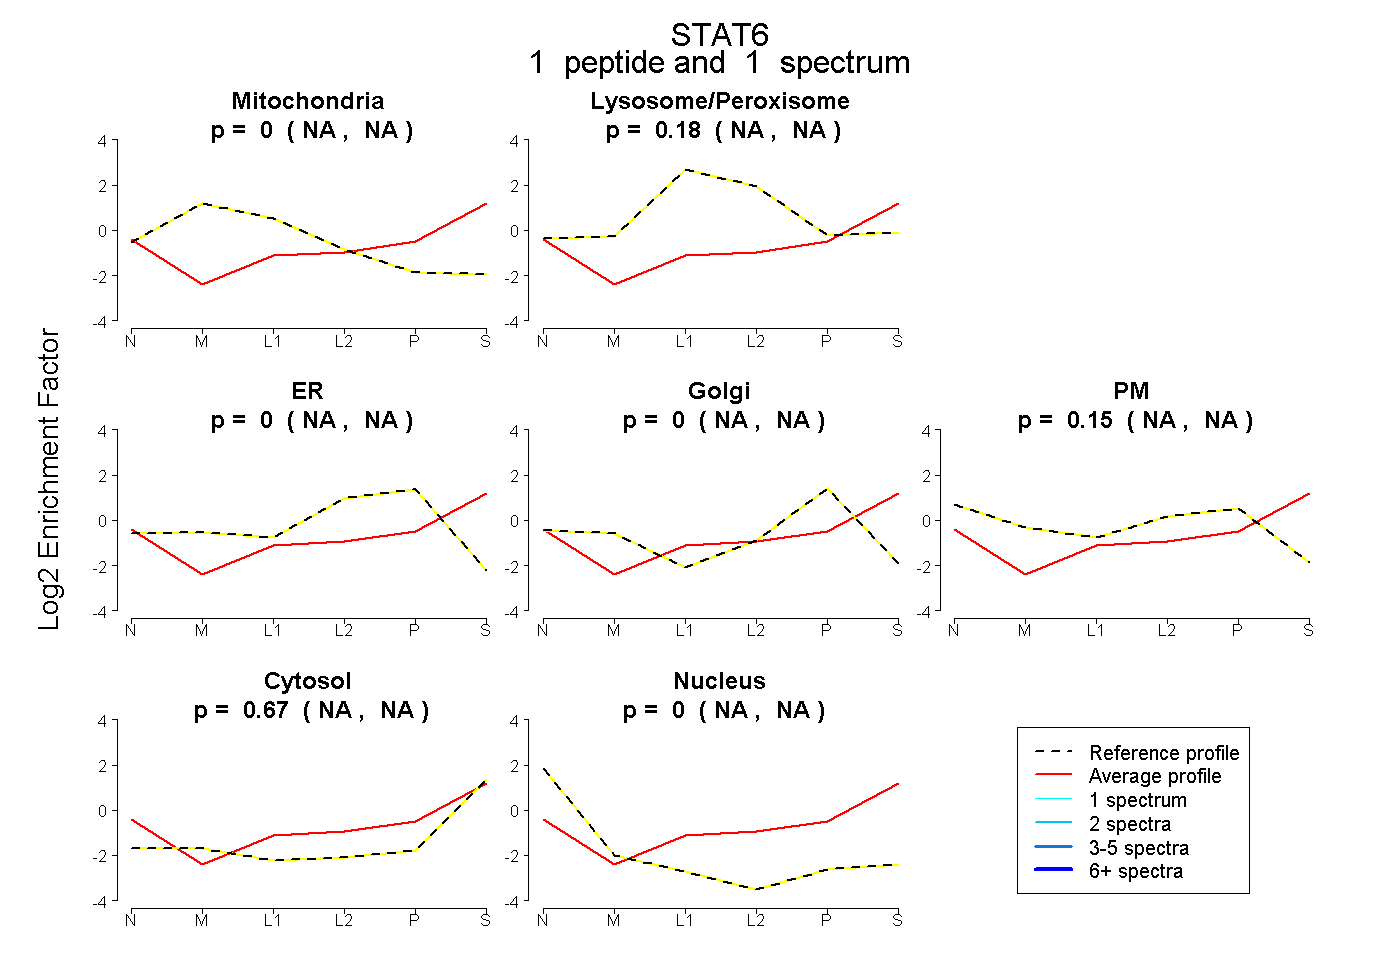 |
0.000 NA | NA |
0.179 NA | NA |
0.000 NA | NA |
0.000 NA | NA |
0.147 NA | NA |
0.672 NA | NA |
0.003 NA | NA |
|||
| Plot | Lyso | Other | |||||||||||
| Expt C |
7 peptides |
11 spectra |
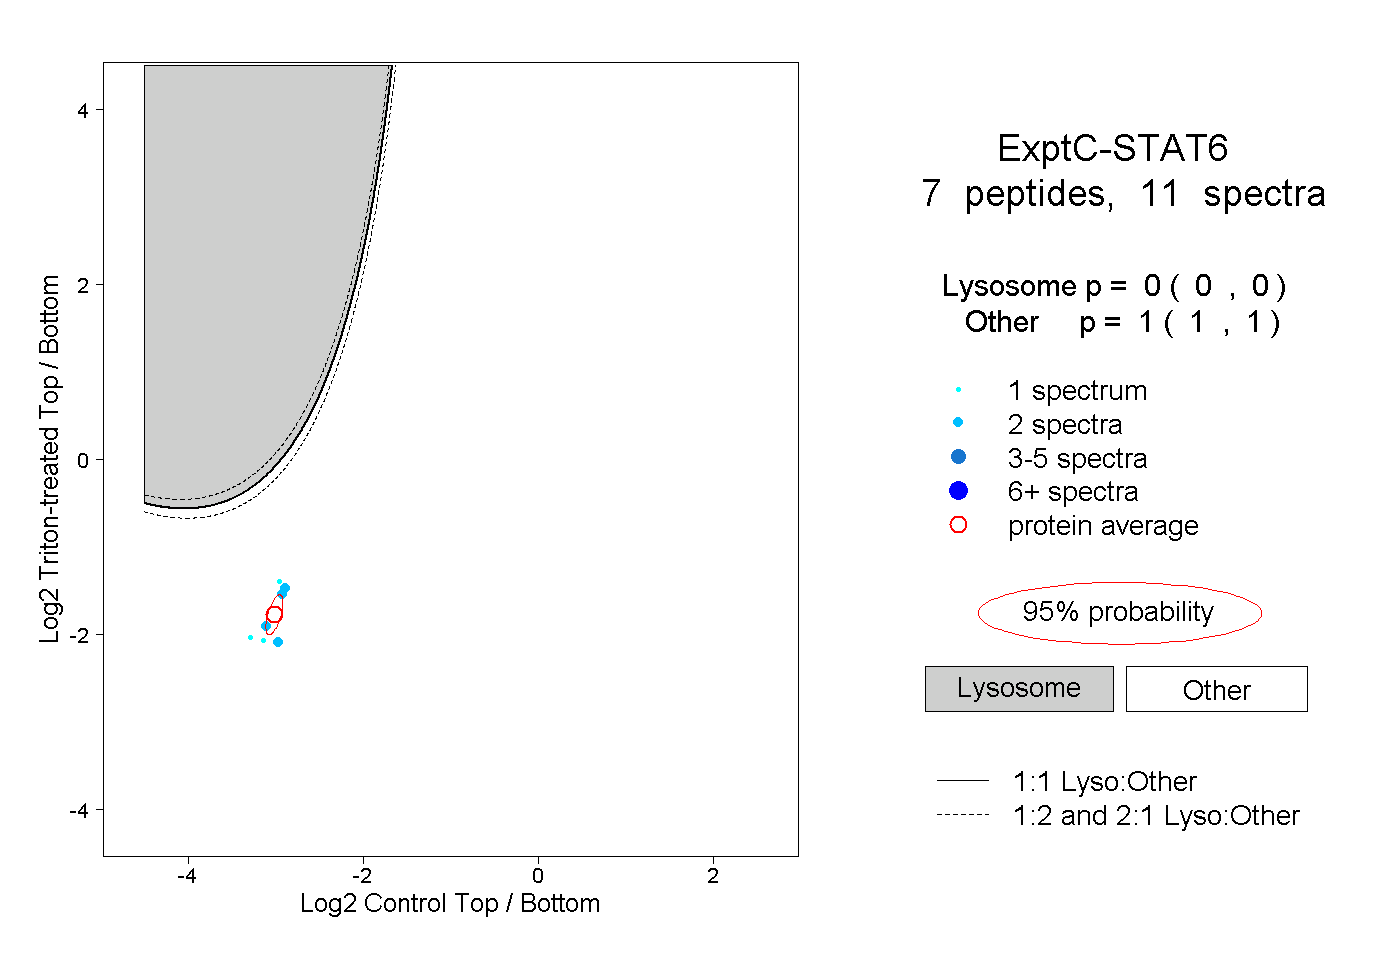 |
0.000 0.000 | 0.000 |
1.000 1.000 | 1.000 |