STAT6
[ENSRNOP00000034983]
Main page
| | | Plot |
Mito |
Lyso |
|
Perox |
ER |
Golgi |
PM |
Cytosol |
Nucleus |
|
| Expt A |
 8
8
peptides |
14
spectra |
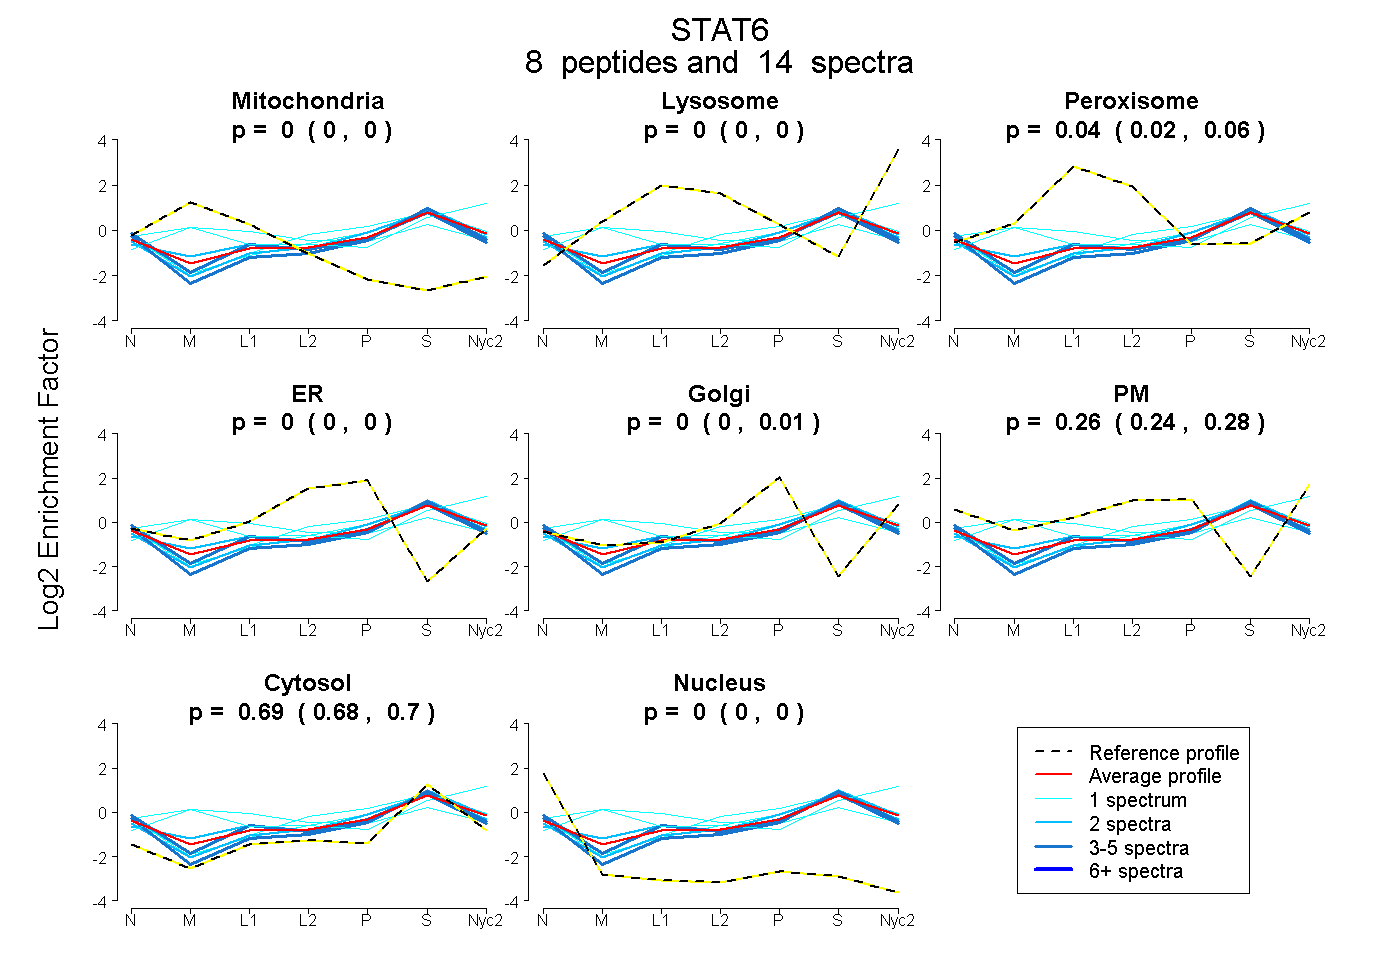 |
0.000
0.000 | 0.000 |
0.000
0.000 | 0.000 |
|
0.044
0.025 | 0.061 |
0.000
0.000 | 0.000 |
0.000
0.000 | 0.007 |
0.265
0.245 | 0.277 |
0.691
0.675 | 0.703 |
0.000
0.000 | 0.000 |
|
| | | Plot |
Mito |
|
Lyso or Perox |
|
ER |
Golgi |
PM |
Cytosol |
Nucleus |
|
| Expt B |
1
peptide |
1
spectrum |
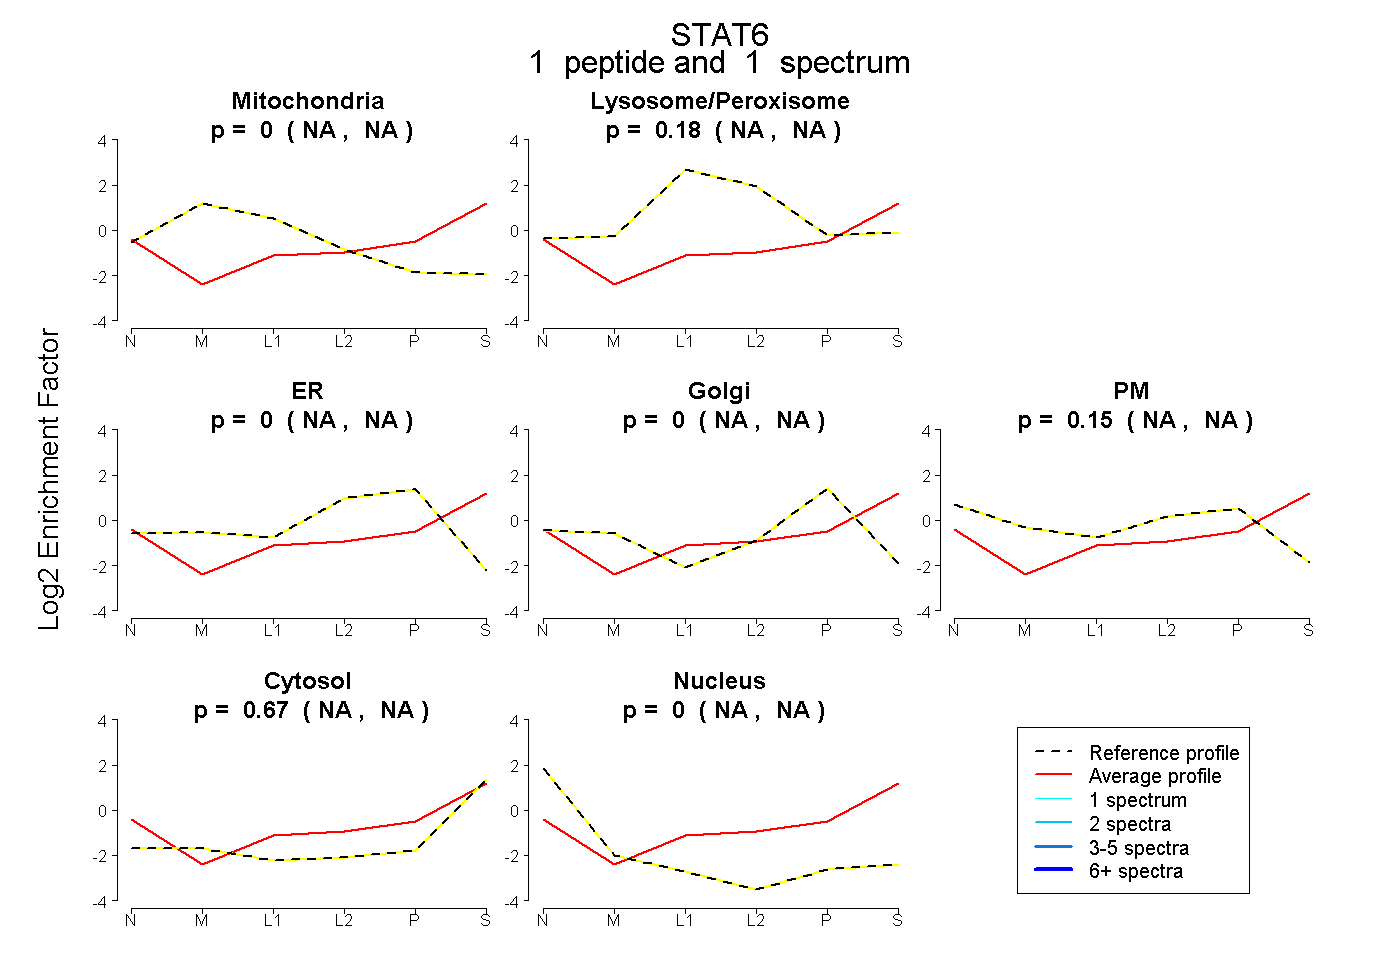 |
0.000
NA | NA |
|
0.179
NA | NA |
|
0.000
NA | NA |
0.000
NA | NA |
0.147
NA | NA |
0.672
NA | NA |
0.003
NA | NA |
|
| | | Plot |
|
Lyso |
|
|
|
|
|
|
|
Other |
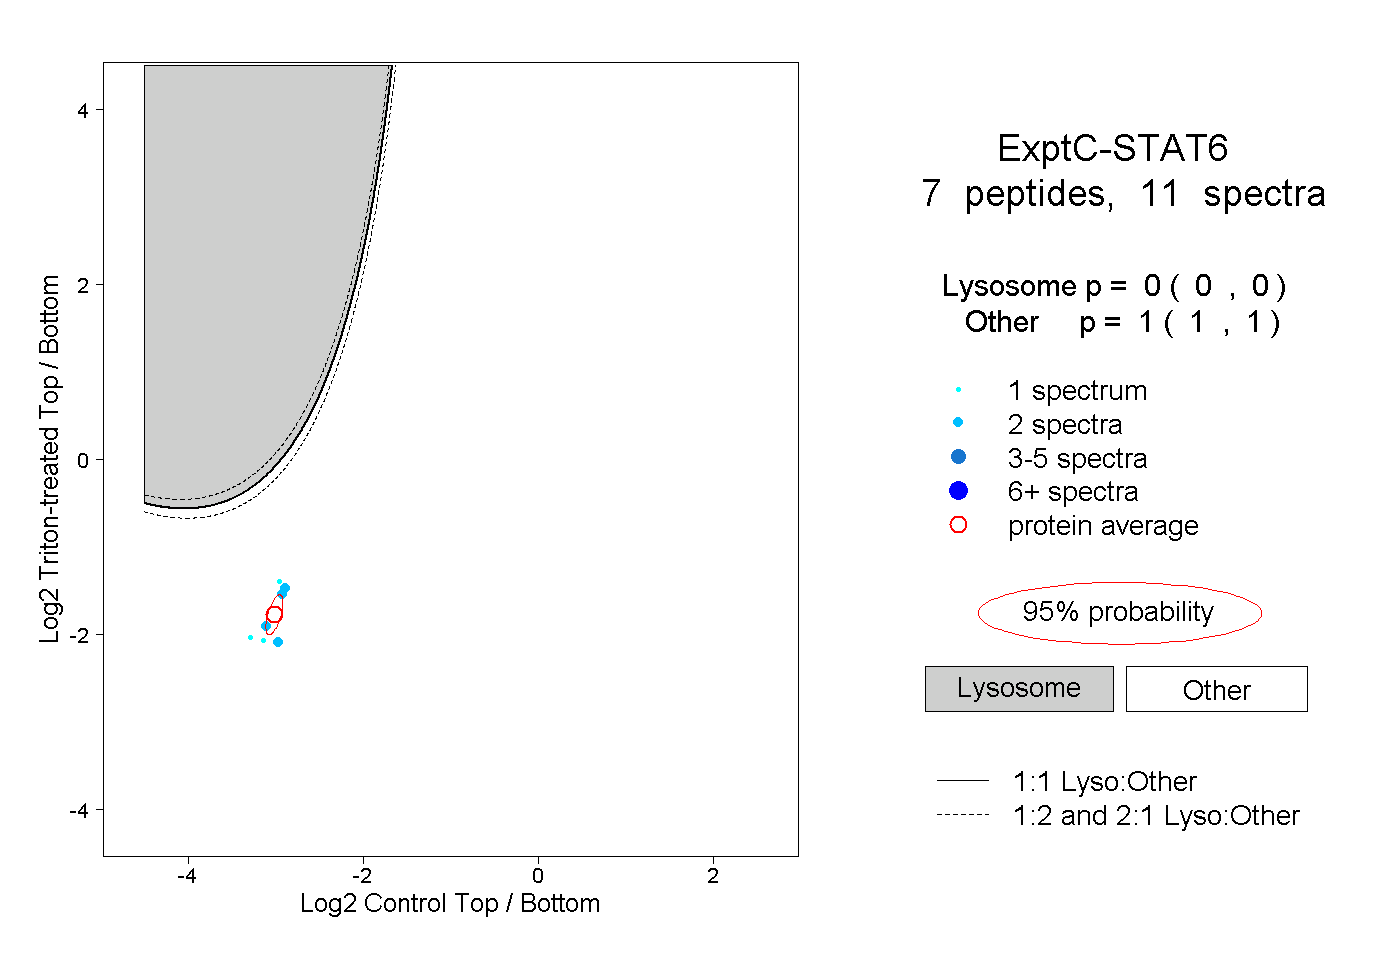
| Expt C |
7
peptides |
11
spectra |
 |
|
0.000
0.000 | 0.000 |
|
|
|
|
|
|
|
1.000
1.000 | 1.000 |
| 1 spectrum, SHYKPEQMGK |
|
0.000 |
|
|
|
|
|
|
|
1.000 |
| 2 spectra, ESLQQGTK |
|
0.000 |
|
|
|
|
|
|
|
1.000 |
| 2 spectra, LYVDFPQHLR |
|
0.000 |
|
|
|
|
|
|
|
1.000 |
| 1 spectrum, QILQGEK |
|
0.000 |
|
|
|
|
|
|
|
1.000 |
| 2 spectra, LVATIR |
|
0.000 |
|
|
|
|
|
|
|
1.000 |
| 2 spectra, FTTALGR |
|
0.000 |
|
|
|
|
|
|
|
1.000 |
| 1 spectrum, ASILSR |
|
0.000 |
|
|
|
|
|
|
|
1.000 |