 9
9peptides
spectra
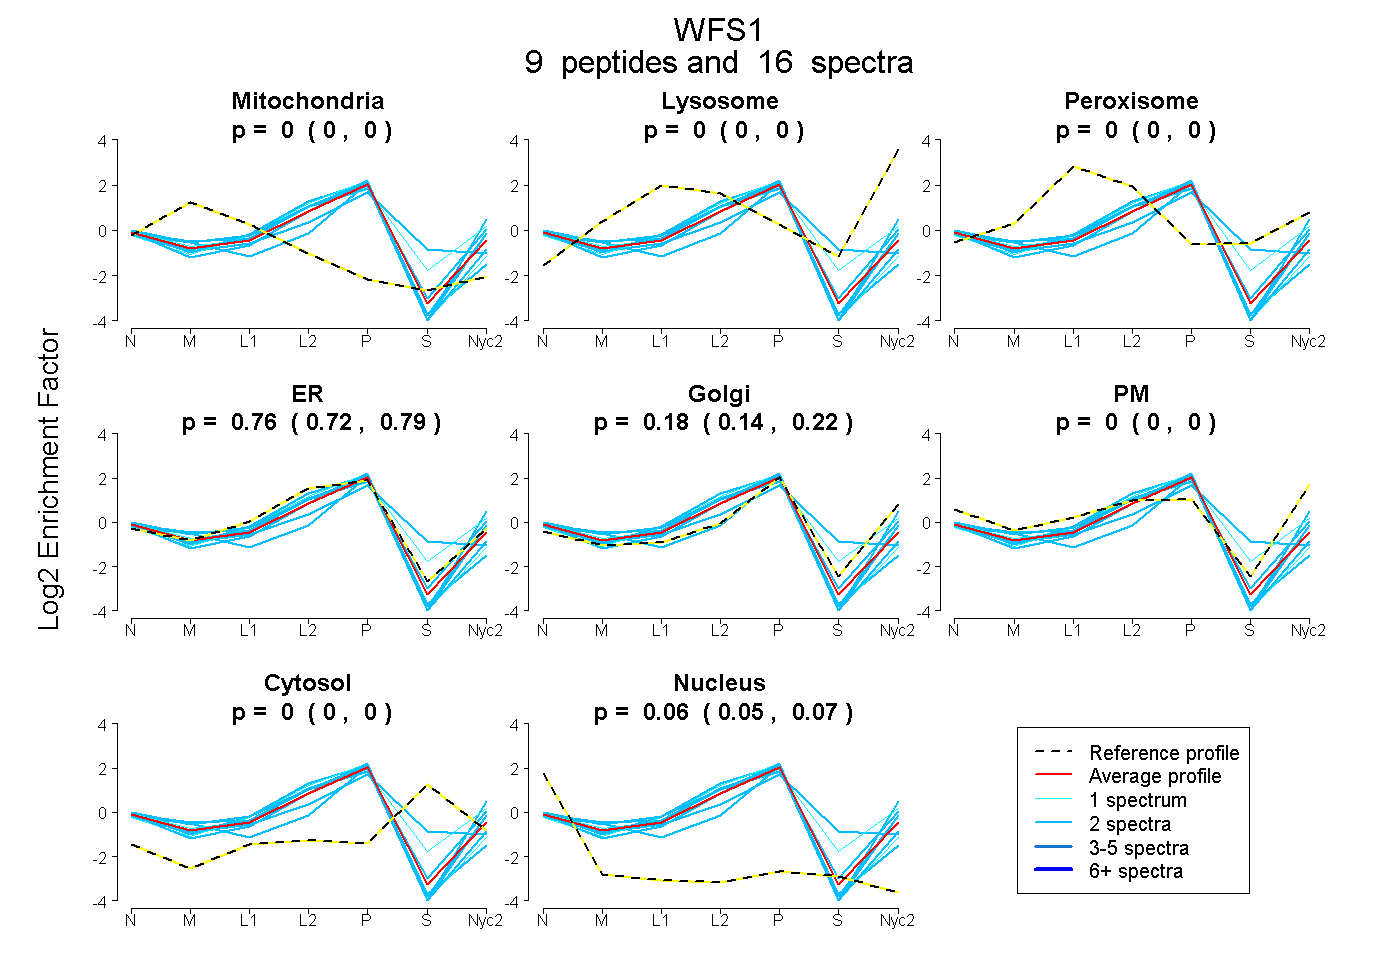
0.000 | 0.000
0.000 | 0.000
0.000 | 0.000
0.719 | 0.793
0.137 | 0.218
0.000 | 0.000
0.000 | 0.000
0.051 | 0.068
1peptide
spectrum
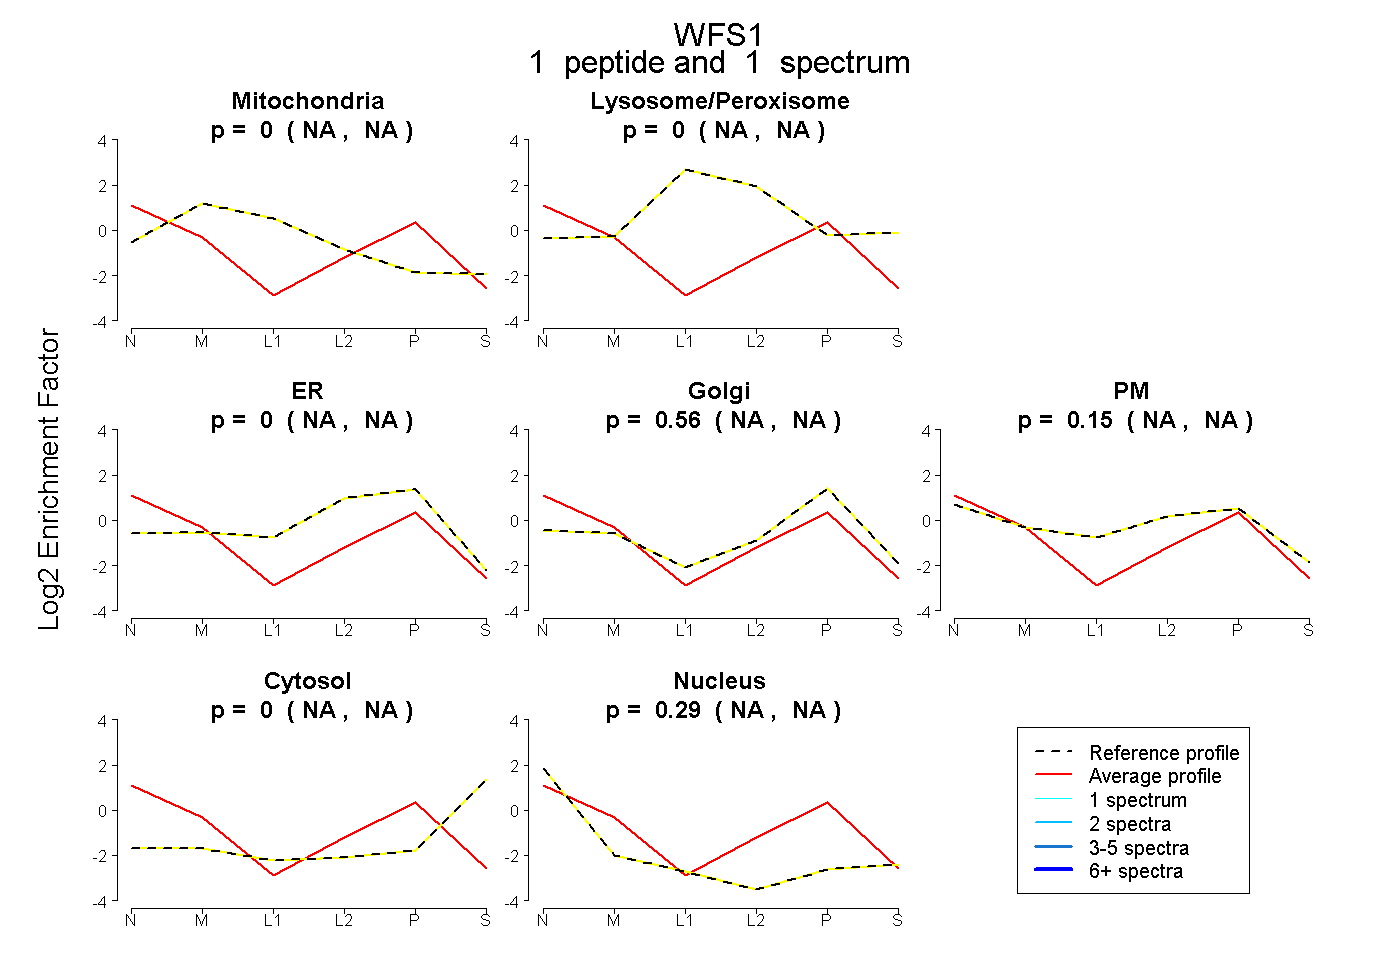
NA | NA
NA | NA
NA | NA
NA | NA
NA | NA
NA | NA
NA | NA
10peptides
spectra
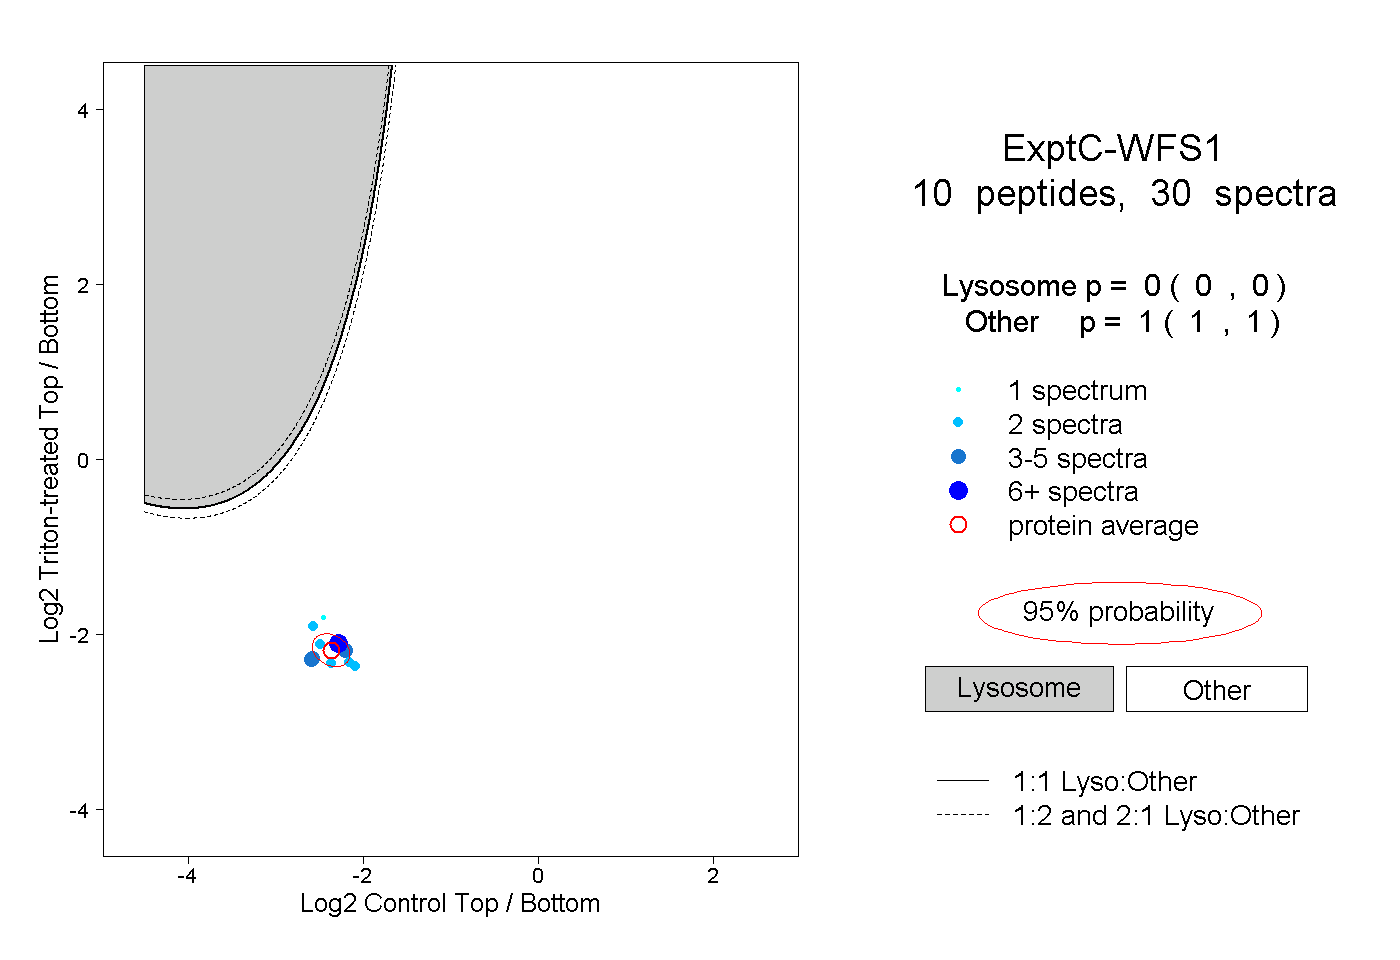
0.000 | 0.000
1.000 | 1.000