WFS1
[ENSRNOP00000032218]
Main page
| | | Plot |
Mito |
Lyso |
|
Perox |
ER |
Golgi |
PM |
Cytosol |
Nucleus |
|
| Expt A |
 9
9
peptides |
16
spectra |
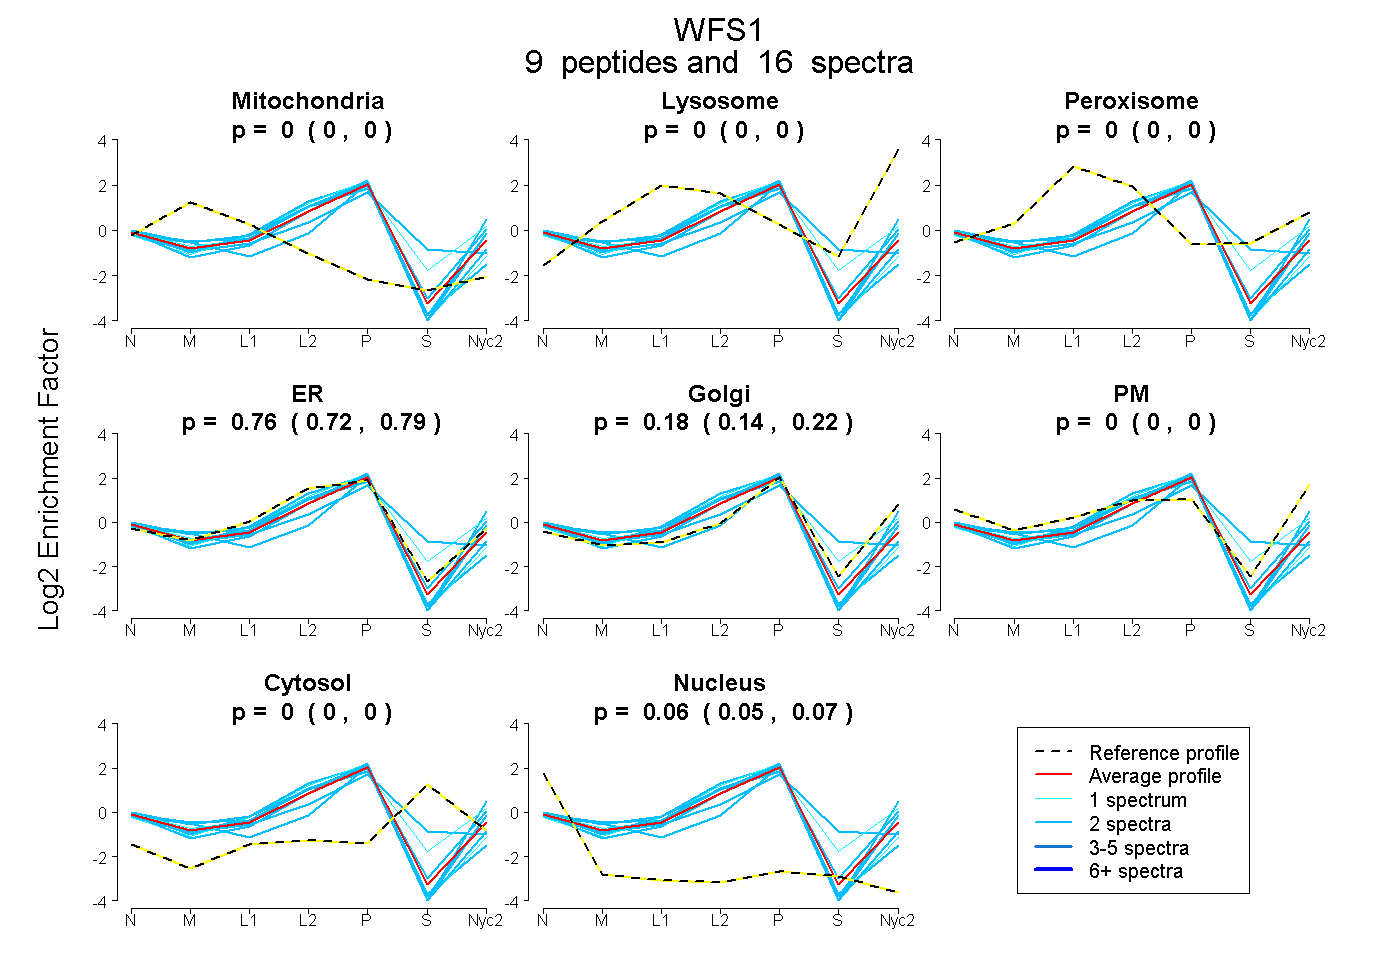 |
0.000
0.000 | 0.000 |
0.000
0.000 | 0.000 |
|
0.000
0.000 | 0.000 |
0.759
0.719 | 0.793 |
0.181
0.137 | 0.218 |
0.000
0.000 | 0.000 |
0.000
0.000 | 0.000 |
0.061
0.051 | 0.068 |
|
| | | Plot |
Mito |
|
Lyso or Perox |
|
ER |
Golgi |
PM |
Cytosol |
Nucleus |
|
| Expt B |
1
peptide |
1
spectrum |
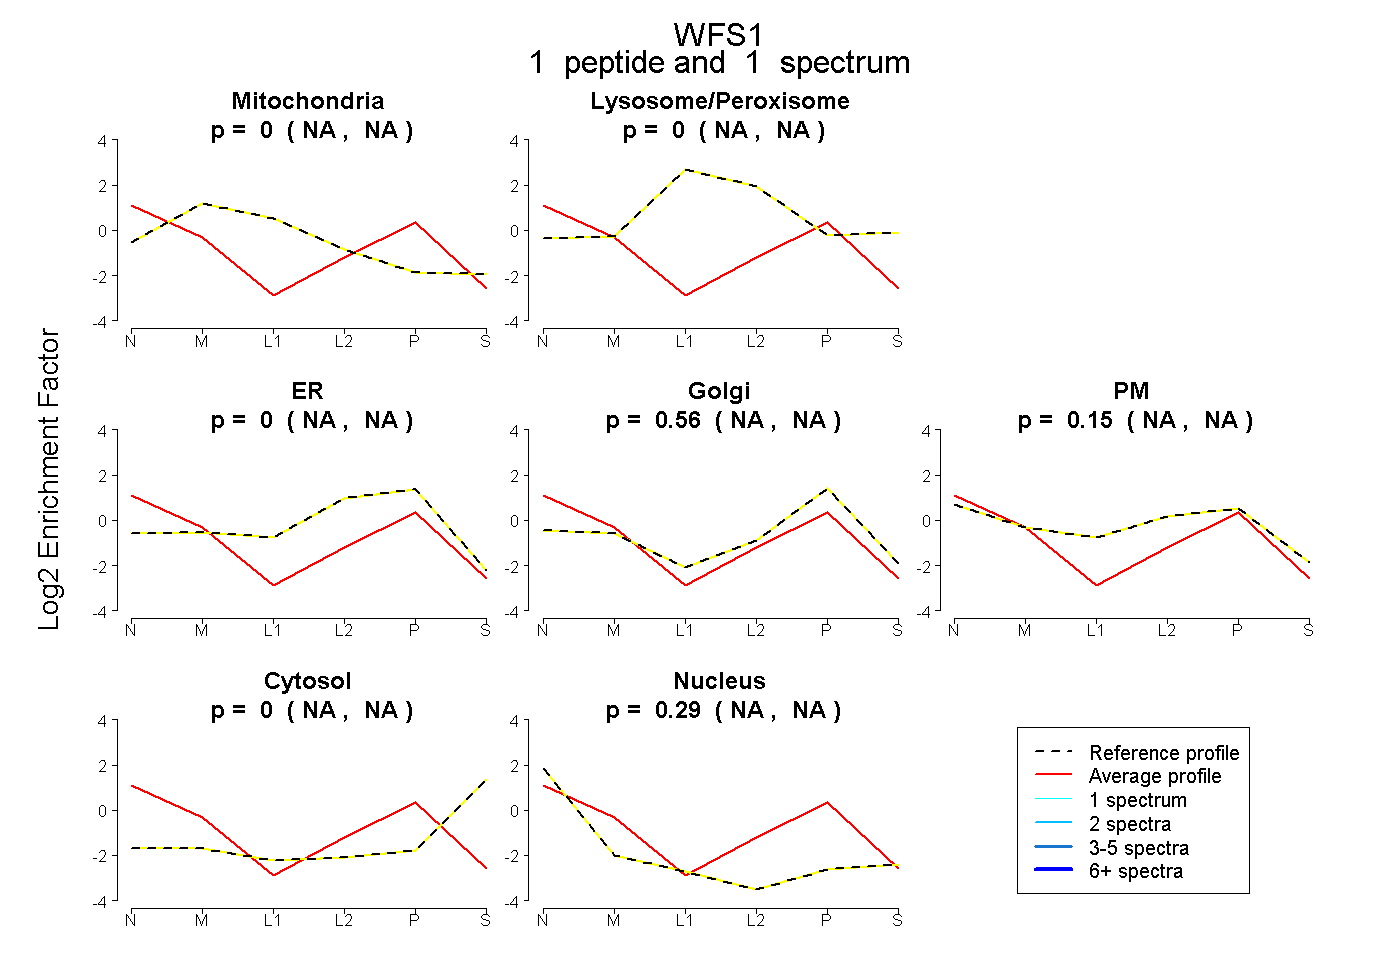 |
0.000
NA | NA |
|
0.000
NA | NA |
|
0.000
NA | NA |
0.564
NA | NA |
0.148
NA | NA |
0.000
NA | NA |
0.288
NA | NA |
|
| | | Plot |
|
Lyso |
|
|
|
|
|
|
|
Other |
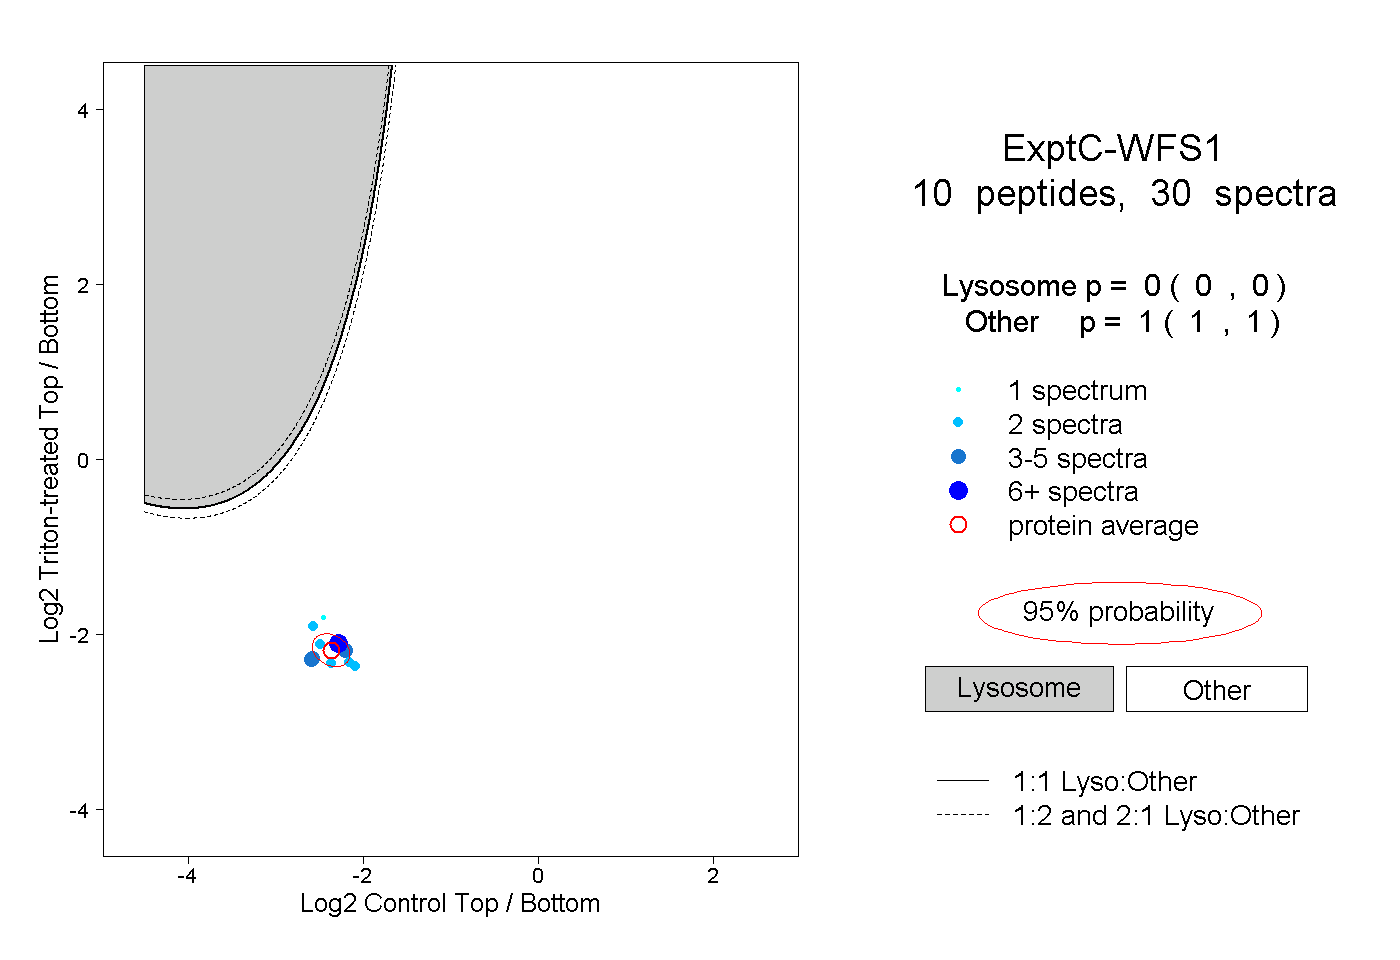
| Expt C |
10
peptides |
30
spectra |
 |
|
0.000
0.000 | 0.000 |
|
|
|
|
|
|
|
1.000
1.000 | 1.000 |
| 2 spectra, SPEDLPLR |
|
0.000 |
|
|
|
|
|
|
|
1.000 |
| 1 spectrum, GHEEDDITK |
|
0.000 |
|
|
|
|
|
|
|
1.000 |
| 2 spectra, VFQDSK |
|
0.000 |
|
|
|
|
|
|
|
1.000 |
| 4 spectra, APRPQPDSSAGR |
|
0.000 |
|
|
|
|
|
|
|
1.000 |
| 2 spectra, LVSSESK |
|
0.000 |
|
|
|
|
|
|
|
1.000 |
| 4 spectra, WPVFELK |
|
0.000 |
|
|
|
|
|
|
|
1.000 |
| 3 spectra, TLTDLLLR |
|
0.000 |
|
|
|
|
|
|
|
1.000 |
| 2 spectra, QLSSETDLER |
|
0.000 |
|
|
|
|
|
|
|
1.000 |
| 8 spectra, AQTEVGK |
|
0.000 |
|
|
|
|
|
|
|
1.000 |
| 2 spectra, GITSENEAEVK |
|
0.000 |
|
|
|
|
|
|
|
1.000 |