 9
9peptides
spectra
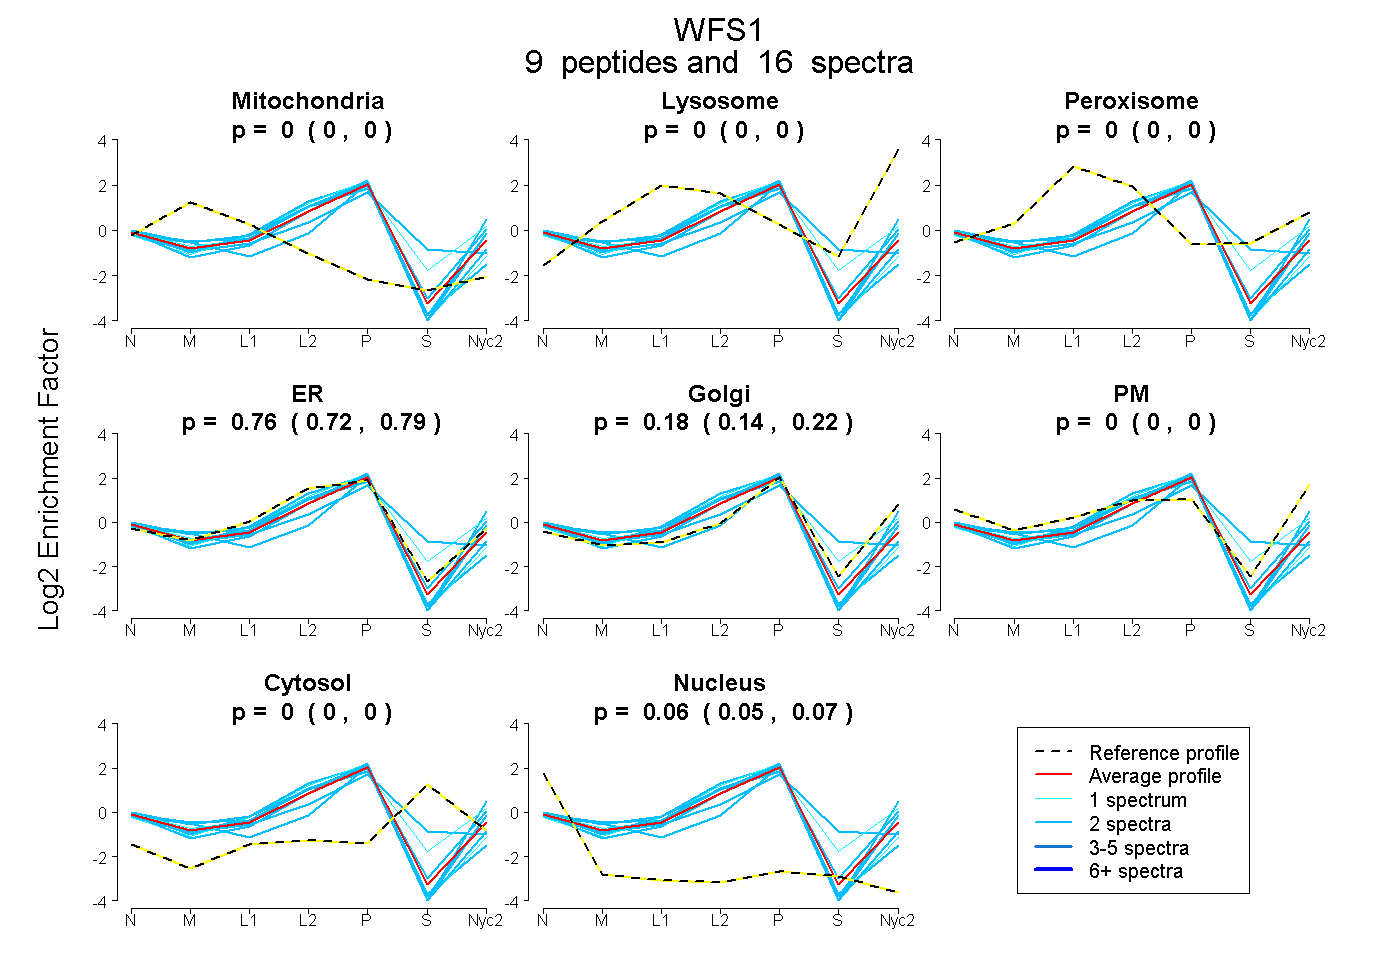
0.000 | 0.000
0.000 | 0.000
0.000 | 0.000
0.719 | 0.793
0.137 | 0.218
0.000 | 0.000
0.000 | 0.000
0.051 | 0.068
| Plot | Mito | Lyso | Perox | ER | Golgi | PM | Cytosol | Nucleus | |||||
| Expt A |
9 peptides |
16 spectra |
|
0.000 0.000 | 0.000 |
0.000 0.000 | 0.000 |
0.000 0.000 | 0.000 |
0.759 0.719 | 0.793 |
0.181 0.137 | 0.218 |
0.000 0.000 | 0.000 |
0.000 0.000 | 0.000 |
0.061 0.051 | 0.068 |
| 1 spectrum, HPCHIK | 0.000 | 0.000 | 0.000 | 0.929 | 0.000 | 0.000 | 0.000 | 0.071 | ||
| 2 spectra, GHEEDDITK | 0.000 | 0.000 | 0.000 | 0.880 | 0.105 | 0.000 | 0.000 | 0.015 | ||
| 2 spectra, APRPQPDSSAGR | 0.000 | 0.000 | 0.000 | 0.600 | 0.211 | 0.000 | 0.000 | 0.189 | ||
| 2 spectra, WPVFELK | 0.000 | 0.000 | 0.000 | 0.793 | 0.182 | 0.000 | 0.000 | 0.026 | ||
| 2 spectra, VTWTGR | 0.026 | 0.000 | 0.000 | 0.685 | 0.177 | 0.104 | 0.000 | 0.006 | ||
| 2 spectra, TLTDLLLR | 0.000 | 0.000 | 0.000 | 0.832 | 0.067 | 0.000 | 0.000 | 0.100 | ||
| 2 spectra, DVLLNLR | 0.000 | 0.000 | 0.000 | 0.589 | 0.230 | 0.181 | 0.000 | 0.000 | ||
| 1 spectrum, IEQDWR | 0.000 | 0.000 | 0.000 | 0.558 | 0.194 | 0.156 | 0.092 | 0.000 | ||
| 2 spectra, GITSENEAEVK | 0.000 | 0.000 | 0.000 | 0.660 | 0.038 | 0.000 | 0.293 | 0.008 |
| Plot | Mito | Lyso or Perox | ER | Golgi | PM | Cytosol | Nucleus | ||||||
| Expt B |
1 peptide |
1 spectrum |
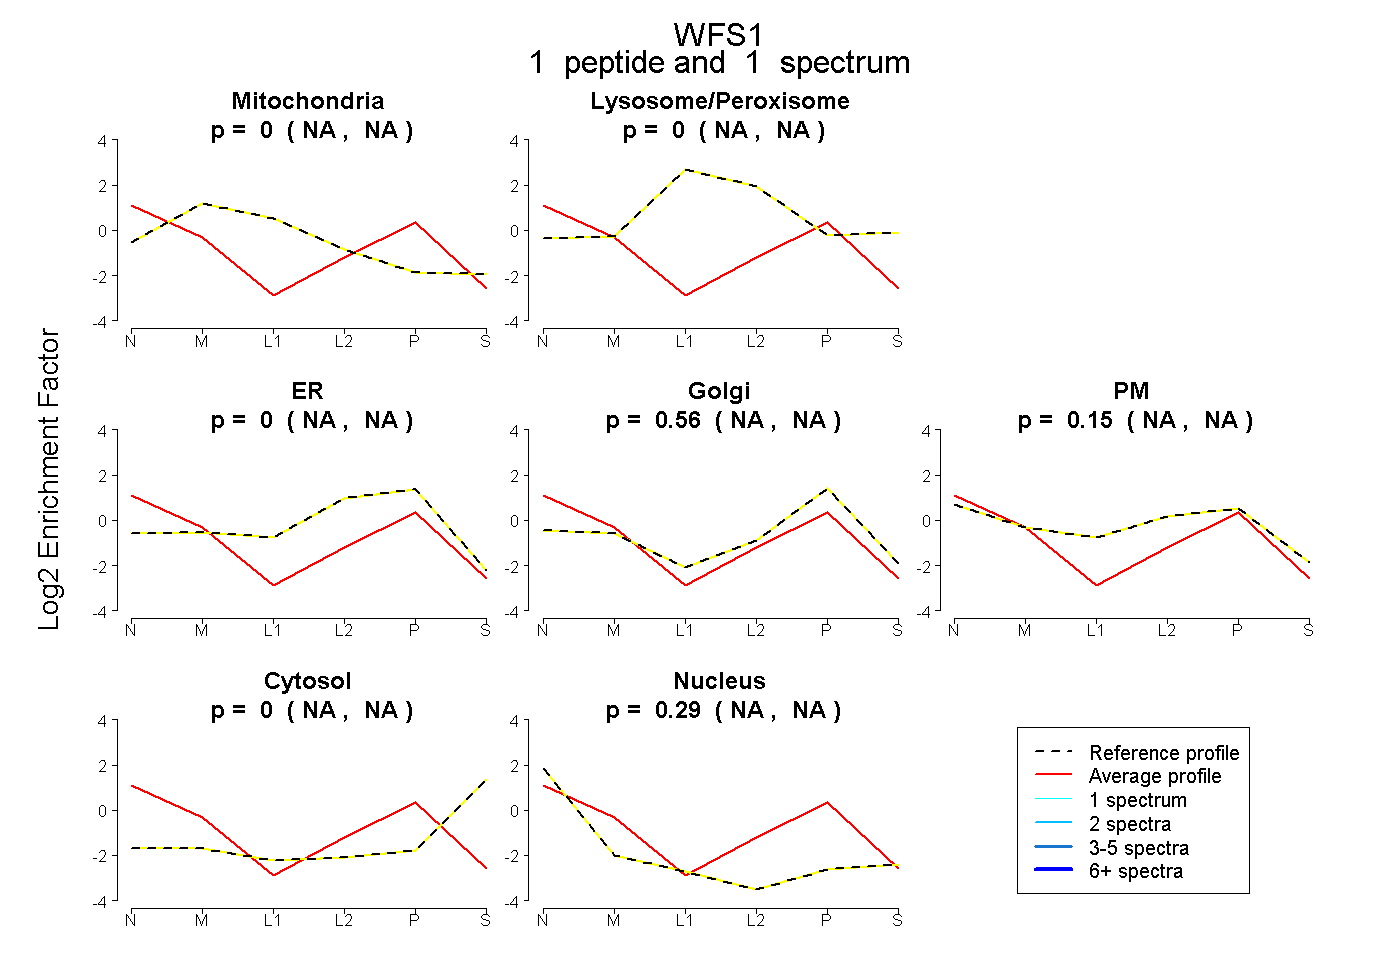 |
0.000 NA | NA |
0.000 NA | NA |
0.000 NA | NA |
0.564 NA | NA |
0.148 NA | NA |
0.000 NA | NA |
0.288 NA | NA |
|||
| Plot | Lyso | Other | |||||||||||
| Expt C |
10 peptides |
30 spectra |
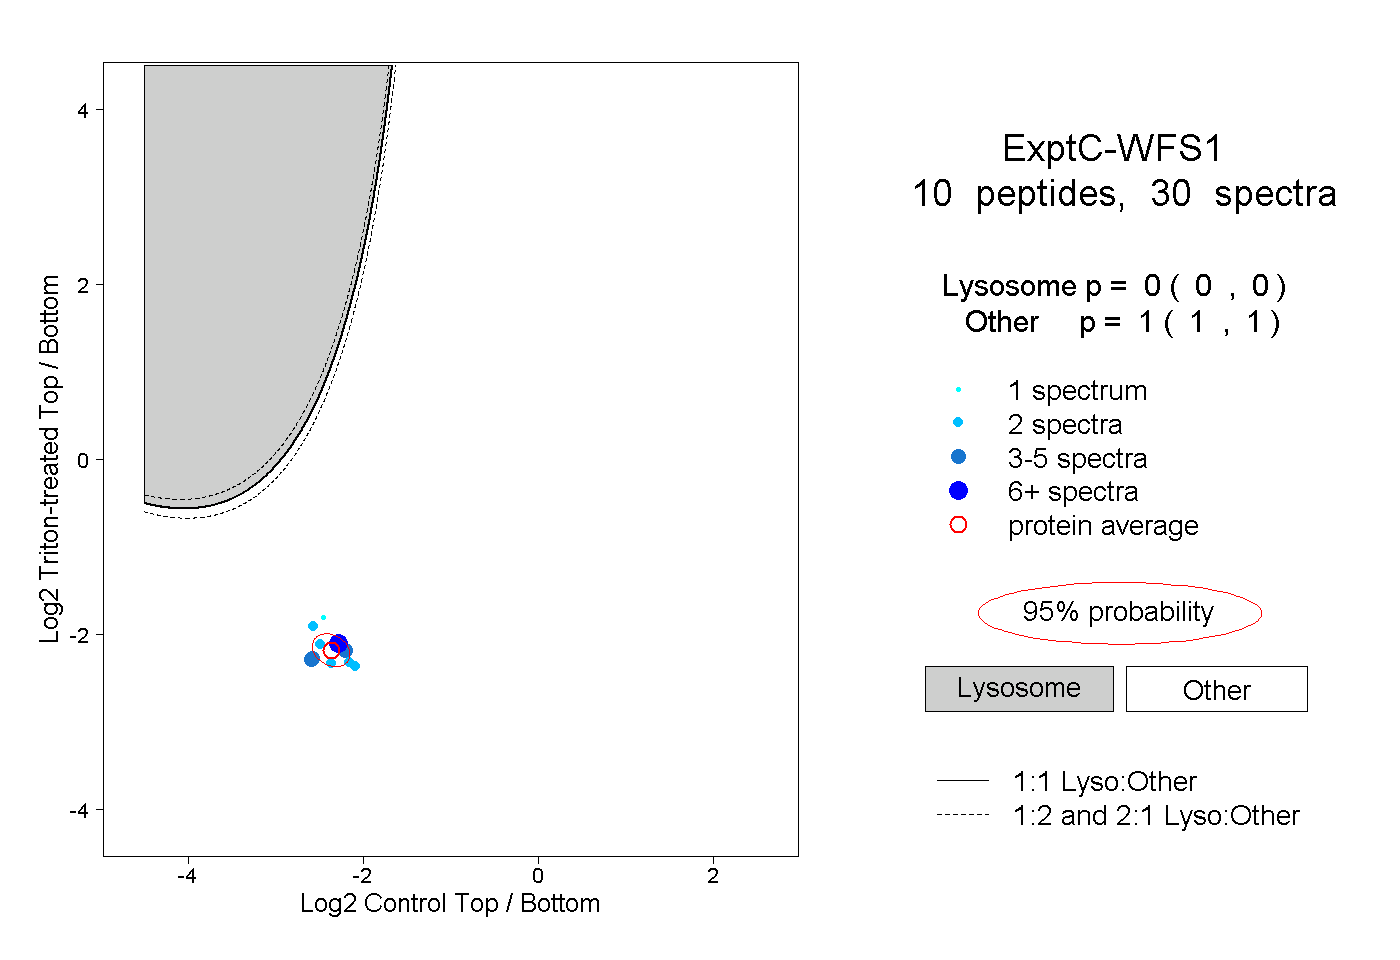 |
0.000 0.000 | 0.000 |
1.000 1.000 | 1.000 |