 8
8peptides
spectra
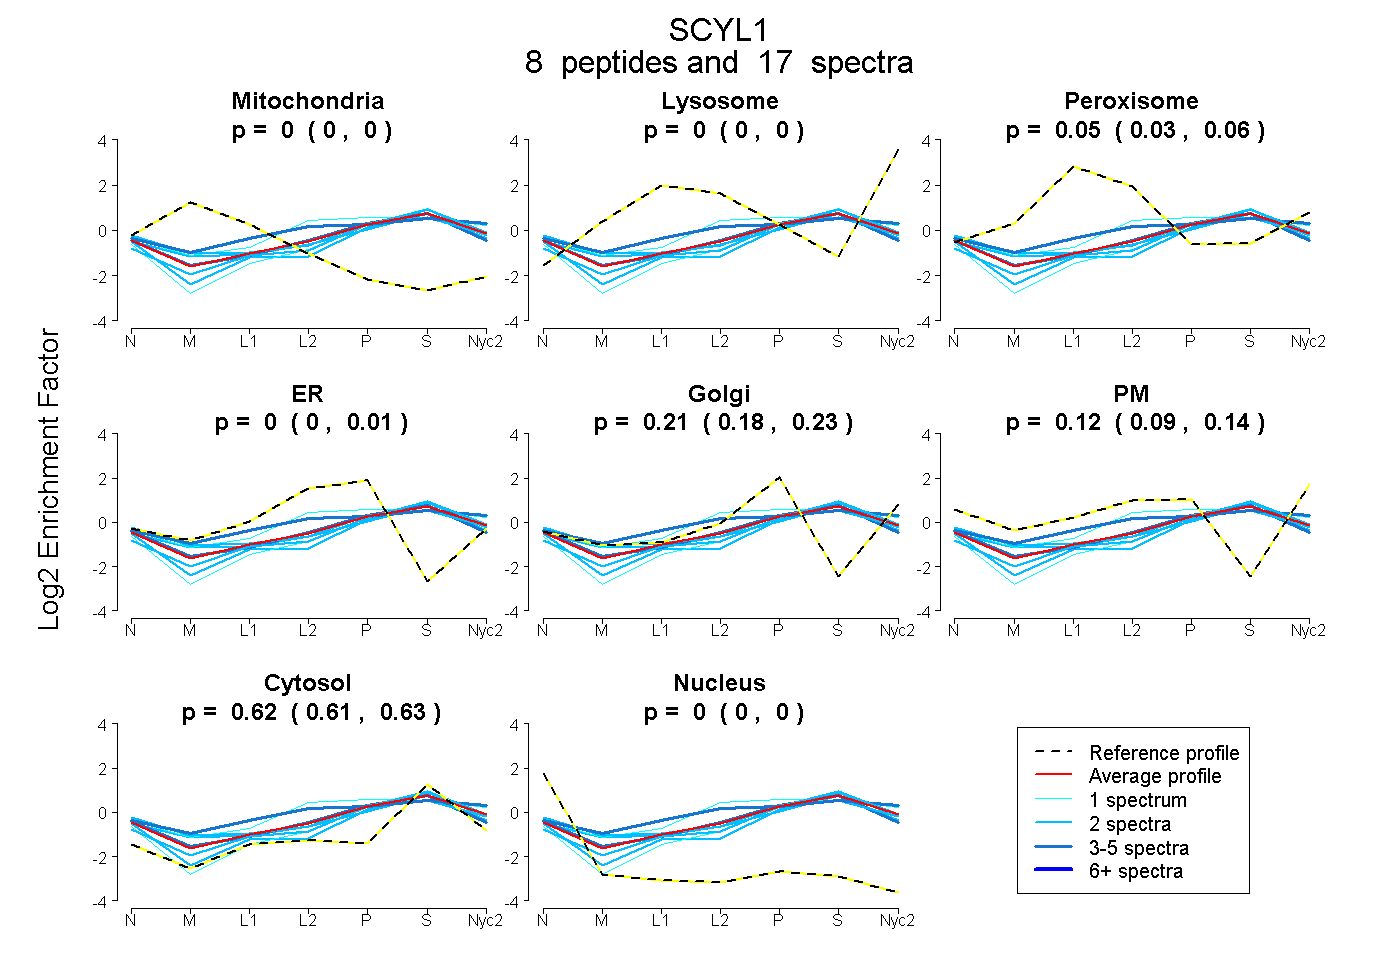
0.000 | 0.000
0.000 | 0.000
0.029 | 0.064
0.000 | 0.010
0.183 | 0.231
0.087 | 0.140
0.611 | 0.633
0.000 | 0.000
2peptides
spectra
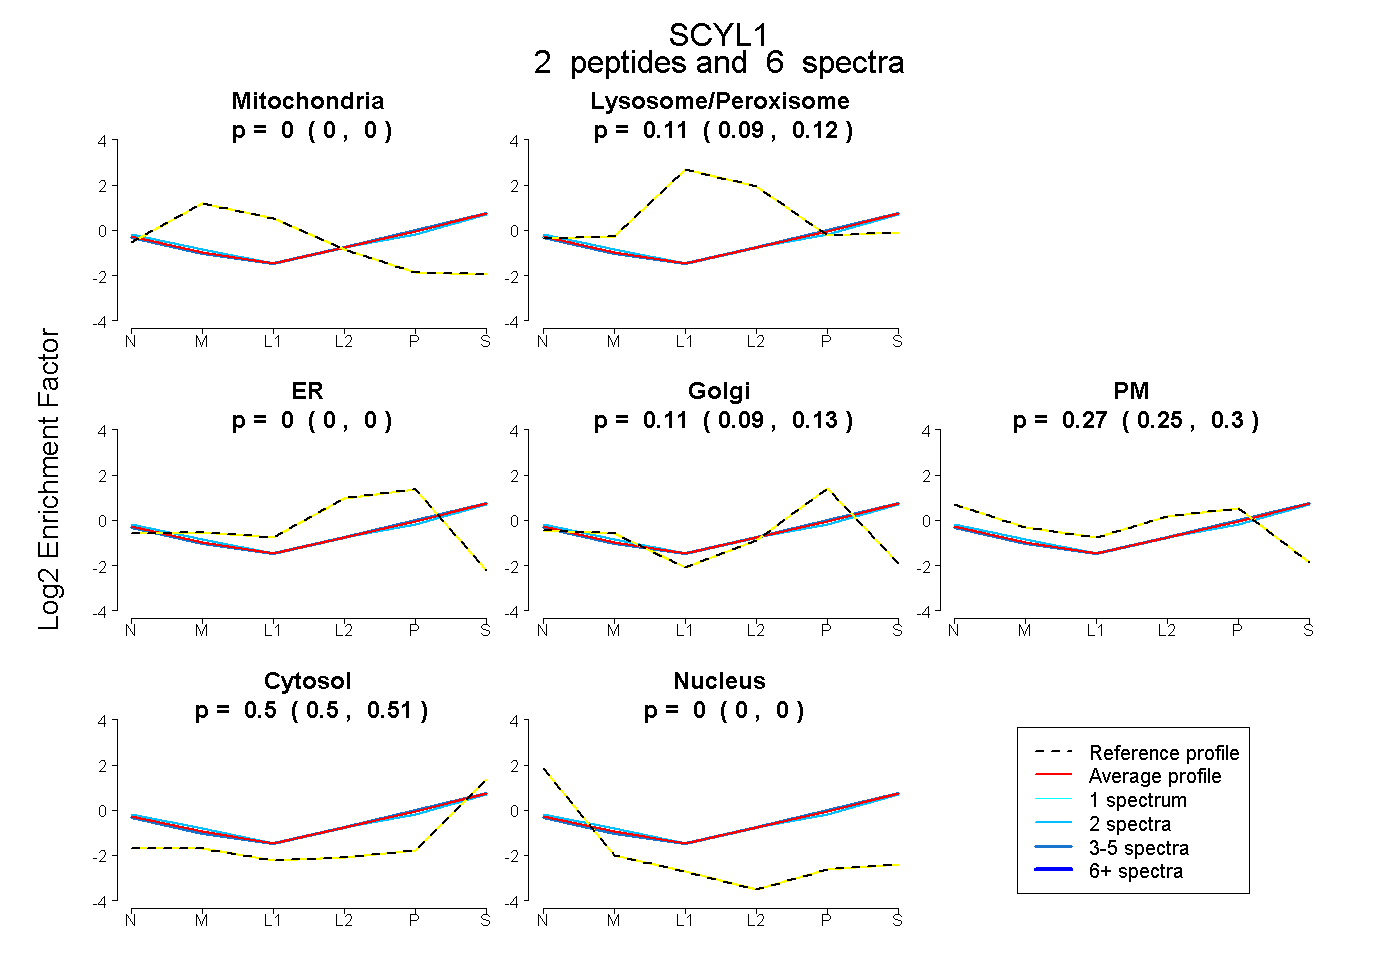
0.000 | 0.000
0.092 | 0.123
0.000 | 0.000
0.091 | 0.130
0.246 | 0.298
0.496 | 0.511
0.000 | 0.000
12peptides
spectra
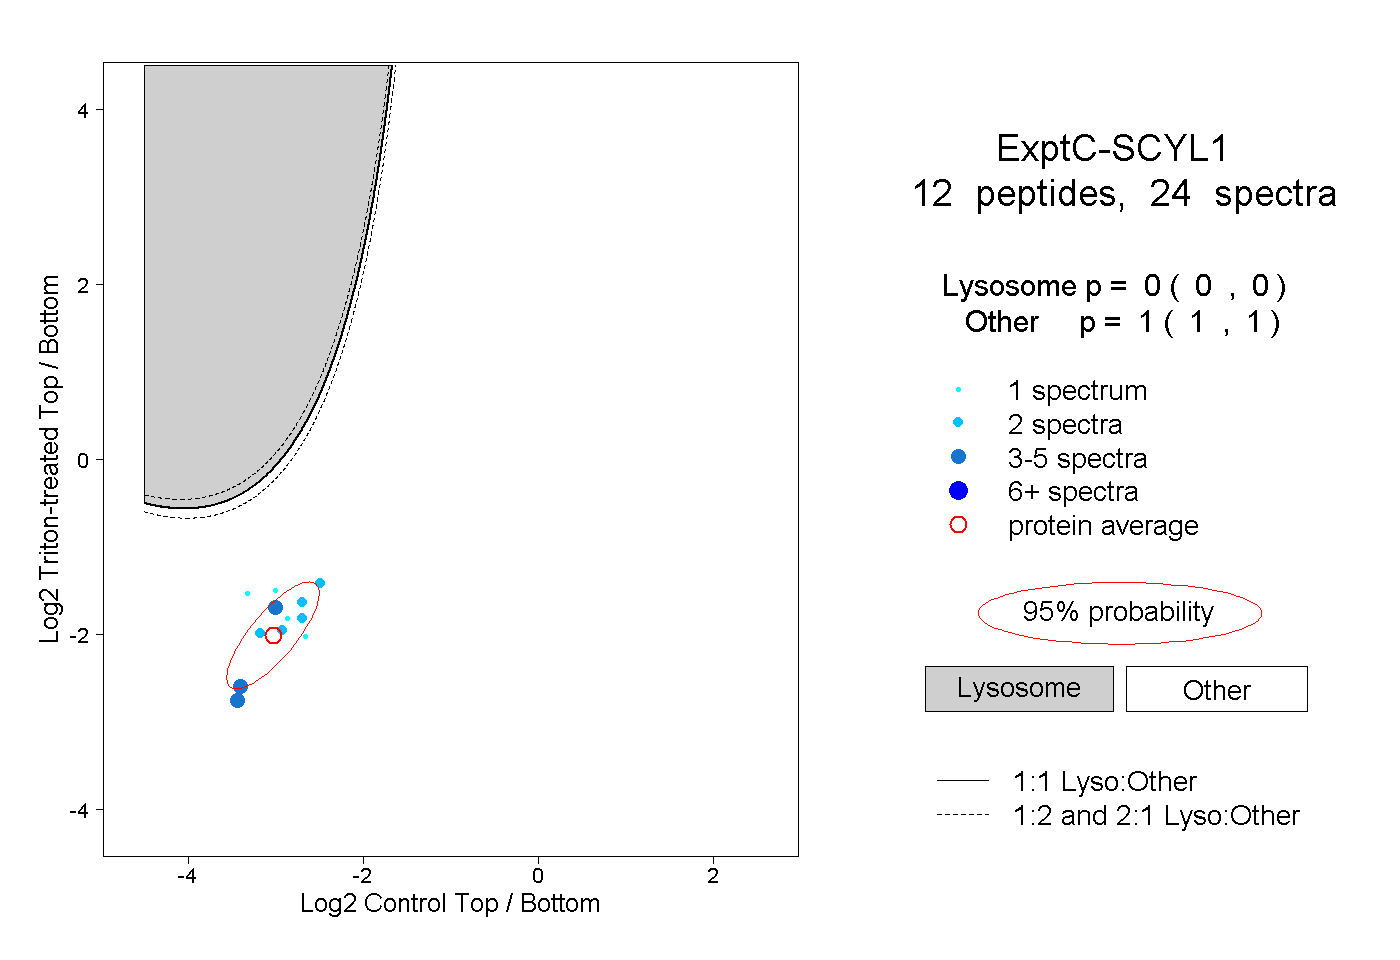
0.000 | 0.000
1.000 | 1.000