 8
8peptides
spectra
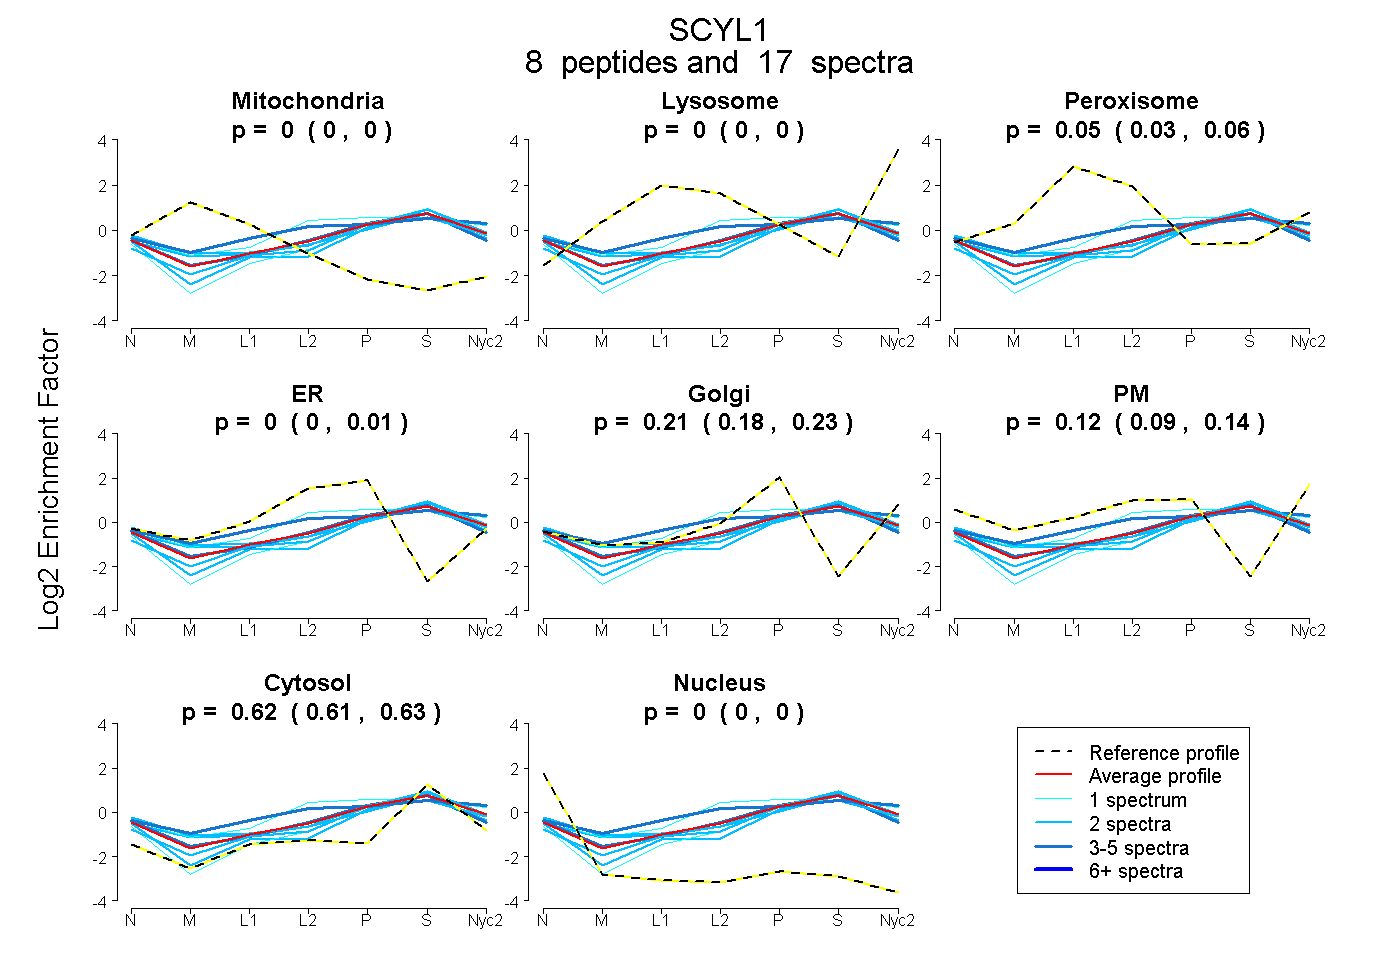
0.000 | 0.000
0.000 | 0.000
0.029 | 0.064
0.000 | 0.010
0.183 | 0.231
0.087 | 0.140
0.611 | 0.633
0.000 | 0.000
| Plot | Mito | Lyso | Perox | ER | Golgi | PM | Cytosol | Nucleus | |||||
| Expt A |
8 peptides |
17 spectra |
|
0.000 0.000 | 0.000 |
0.000 0.000 | 0.000 |
0.049 0.029 | 0.064 |
0.000 0.000 | 0.010 |
0.213 0.183 | 0.231 |
0.115 0.087 | 0.140 |
0.622 0.611 | 0.633 |
0.000 0.000 | 0.000 |
| 2 spectra, WSADMWR | 0.000 | 0.037 | 0.000 | 0.000 | 0.272 | 0.000 | 0.690 | 0.000 | ||
| 3 spectra, VRPNPAR | 0.000 | 0.010 | 0.202 | 0.000 | 0.118 | 0.199 | 0.470 | 0.000 | ||
| 1 spectrum, SMLLLAPK | 0.000 | 0.000 | 0.000 | 0.000 | 0.263 | 0.000 | 0.737 | 0.000 | ||
| 1 spectrum, FFQELSK | 0.000 | 0.071 | 0.033 | 0.192 | 0.000 | 0.205 | 0.498 | 0.000 | ||
| 2 spectra, DDQGPIR | 0.000 | 0.000 | 0.085 | 0.000 | 0.214 | 0.071 | 0.631 | 0.000 | ||
| 2 spectra, APGGFMSNR | 0.000 | 0.000 | 0.000 | 0.000 | 0.270 | 0.000 | 0.730 | 0.000 | ||
| 2 spectra, VLTSAFSR | 0.000 | 0.000 | 0.051 | 0.000 | 0.201 | 0.174 | 0.574 | 0.000 | ||
| 4 spectra, FLQNCR | 0.000 | 0.000 | 0.012 | 0.143 | 0.133 | 0.066 | 0.646 | 0.000 |
| Plot | Mito | Lyso or Perox | ER | Golgi | PM | Cytosol | Nucleus | ||||||
| Expt B |
2 peptides |
6 spectra |
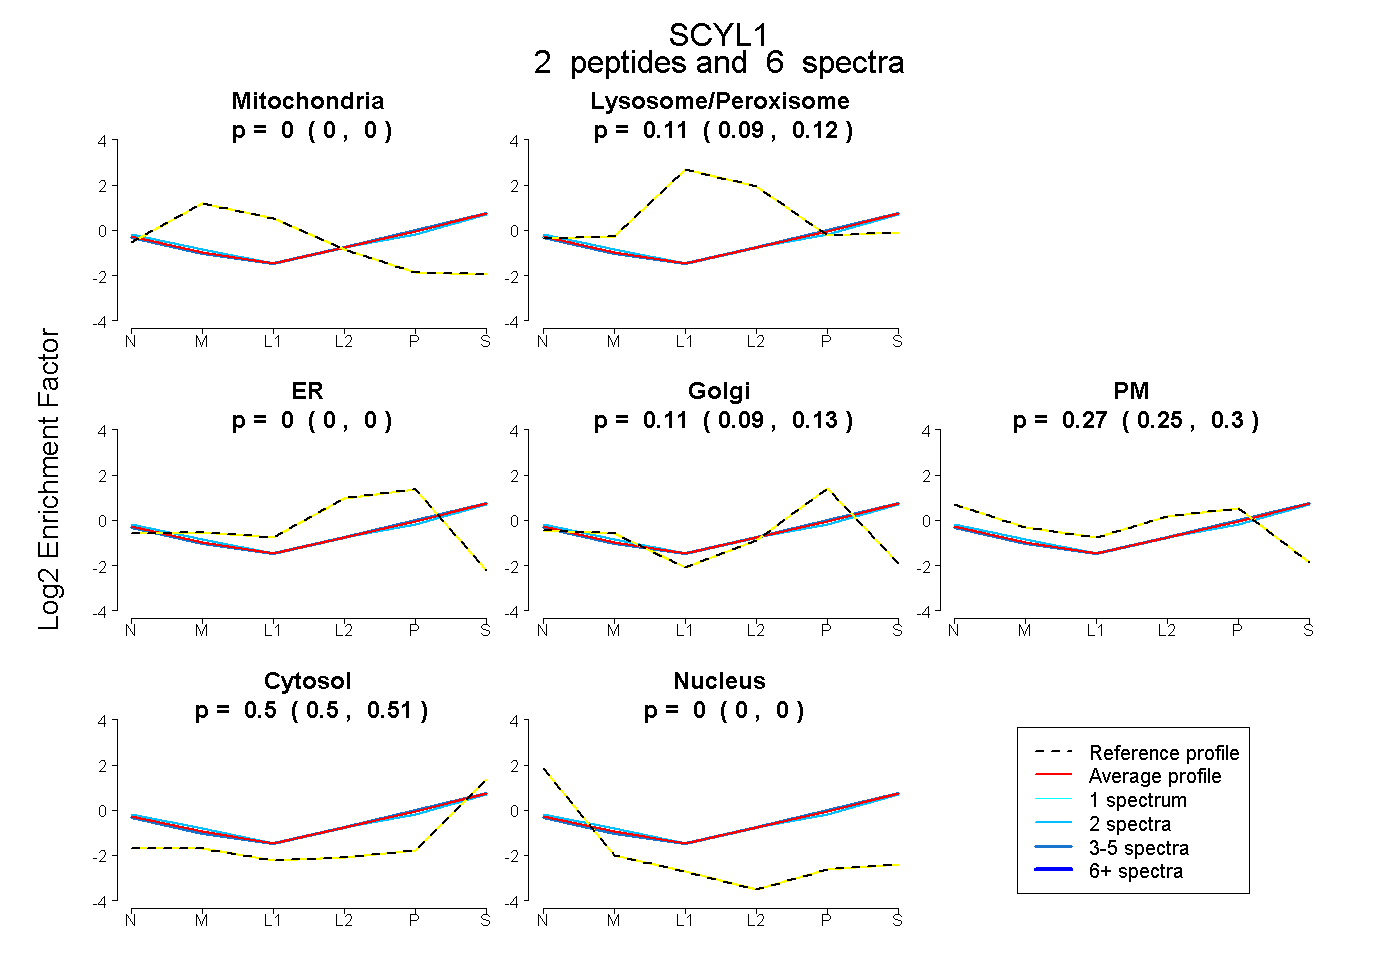 |
0.000 0.000 | 0.000 |
0.109 0.092 | 0.123 |
0.000 0.000 | 0.000 |
0.112 0.091 | 0.130 |
0.275 0.246 | 0.298 |
0.504 0.496 | 0.511 |
0.000 0.000 | 0.000 |
|||
| Plot | Lyso | Other | |||||||||||
| Expt C |
12 peptides |
24 spectra |
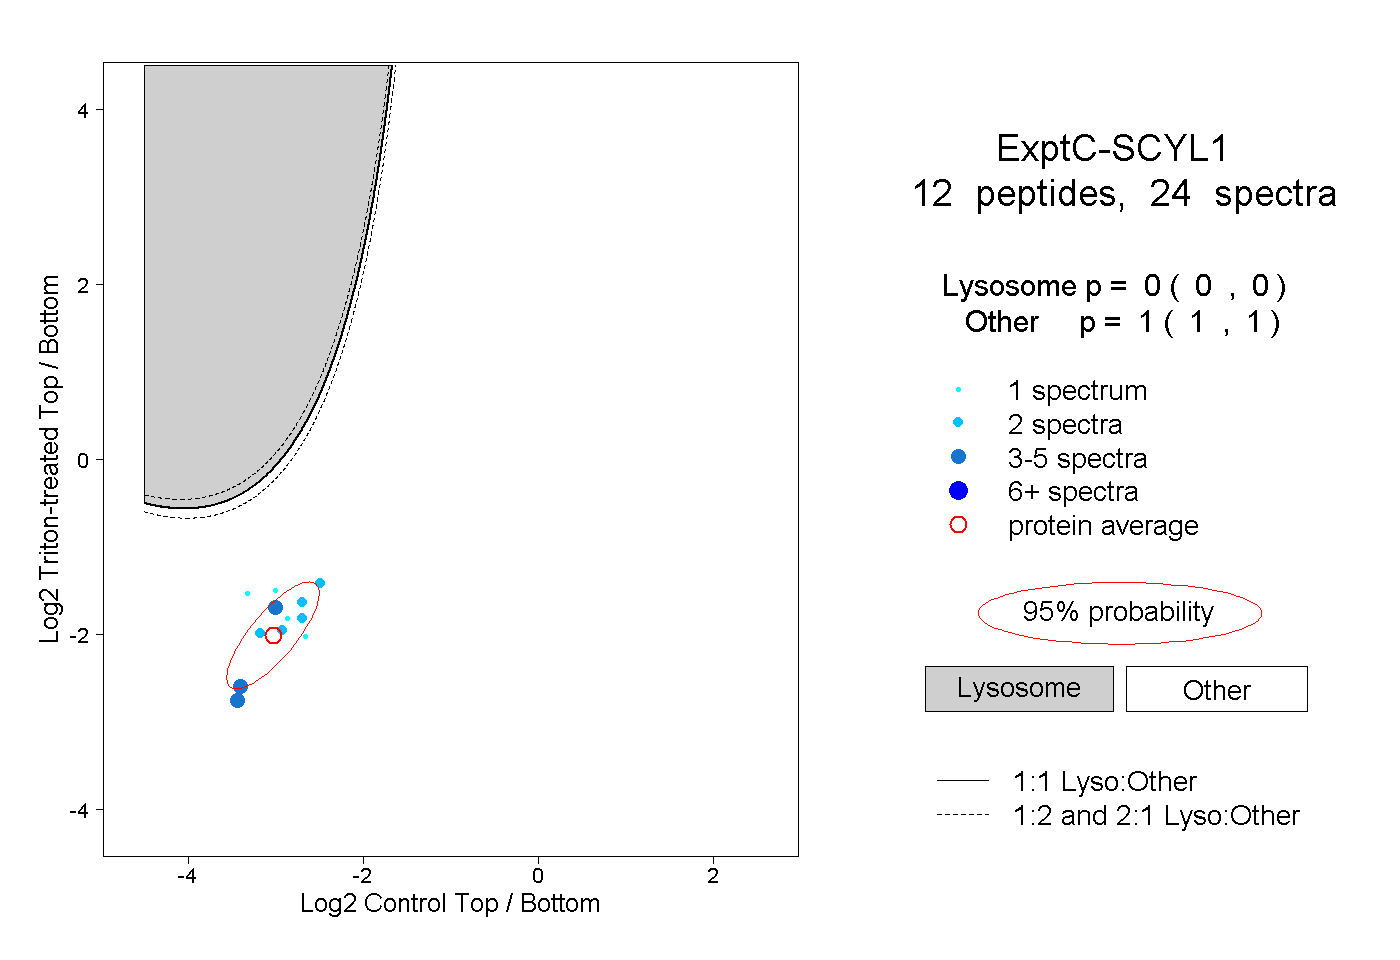 |
0.000 0.000 | 0.000 |
1.000 1.000 | 1.000 |