SCYL1
[ENSRNOP00000030146]
Main page
| | | Plot |
Mito |
Lyso |
|
Perox |
ER |
Golgi |
PM |
Cytosol |
Nucleus |
|
| Expt A |
 8
8
peptides |
17
spectra |
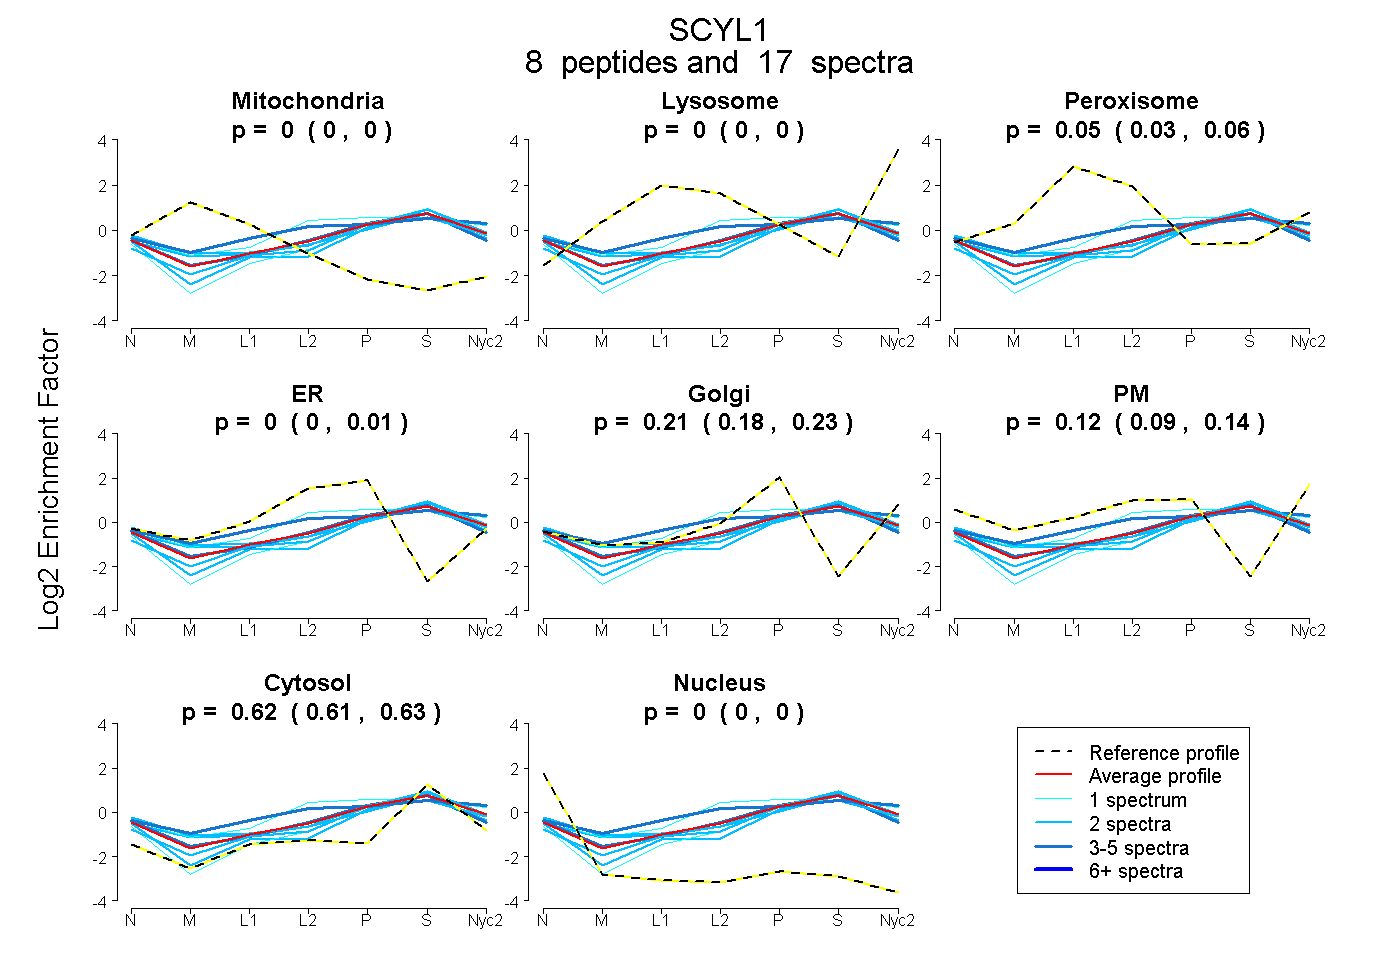 |
0.000
0.000 | 0.000 |
0.000
0.000 | 0.000 |
|
0.049
0.029 | 0.064 |
0.000
0.000 | 0.010 |
0.213
0.183 | 0.231 |
0.115
0.087 | 0.140 |
0.622
0.611 | 0.633 |
0.000
0.000 | 0.000 |
|
| | | Plot |
Mito |
|
Lyso or Perox |
|
ER |
Golgi |
PM |
Cytosol |
Nucleus |
|
| Expt B |
2
peptides |
6
spectra |
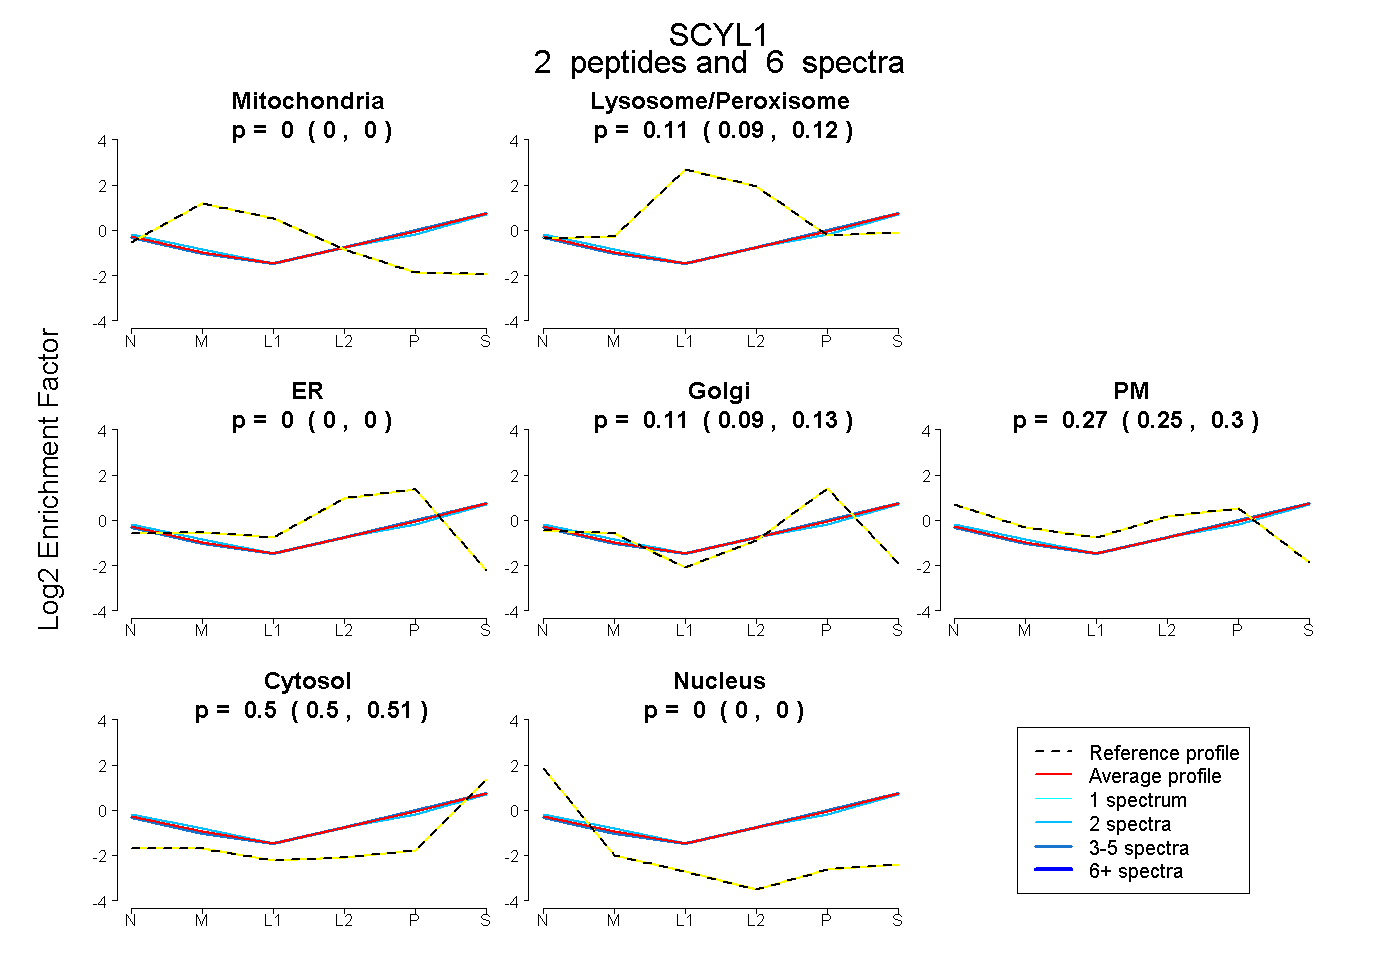 |
0.000
0.000 | 0.000 |
|
0.109
0.092 | 0.123 |
|
0.000
0.000 | 0.000 |
0.112
0.091 | 0.130 |
0.275
0.246 | 0.298 |
0.504
0.496 | 0.511 |
0.000
0.000 | 0.000 |
|
| 4 spectra, VLTSAFSR |
0.000 |
|
0.125 |
|
0.000 |
0.162 |
0.213 |
0.500 |
0.000 |
|
| 2 spectra, IGSYLSASTR |
0.000 |
|
0.078 |
|
0.000 |
0.012 |
0.397 |
0.512 |
0.000 |
|
| | | Plot |
|
Lyso |
|
|
|
|
|
|
|
Other |
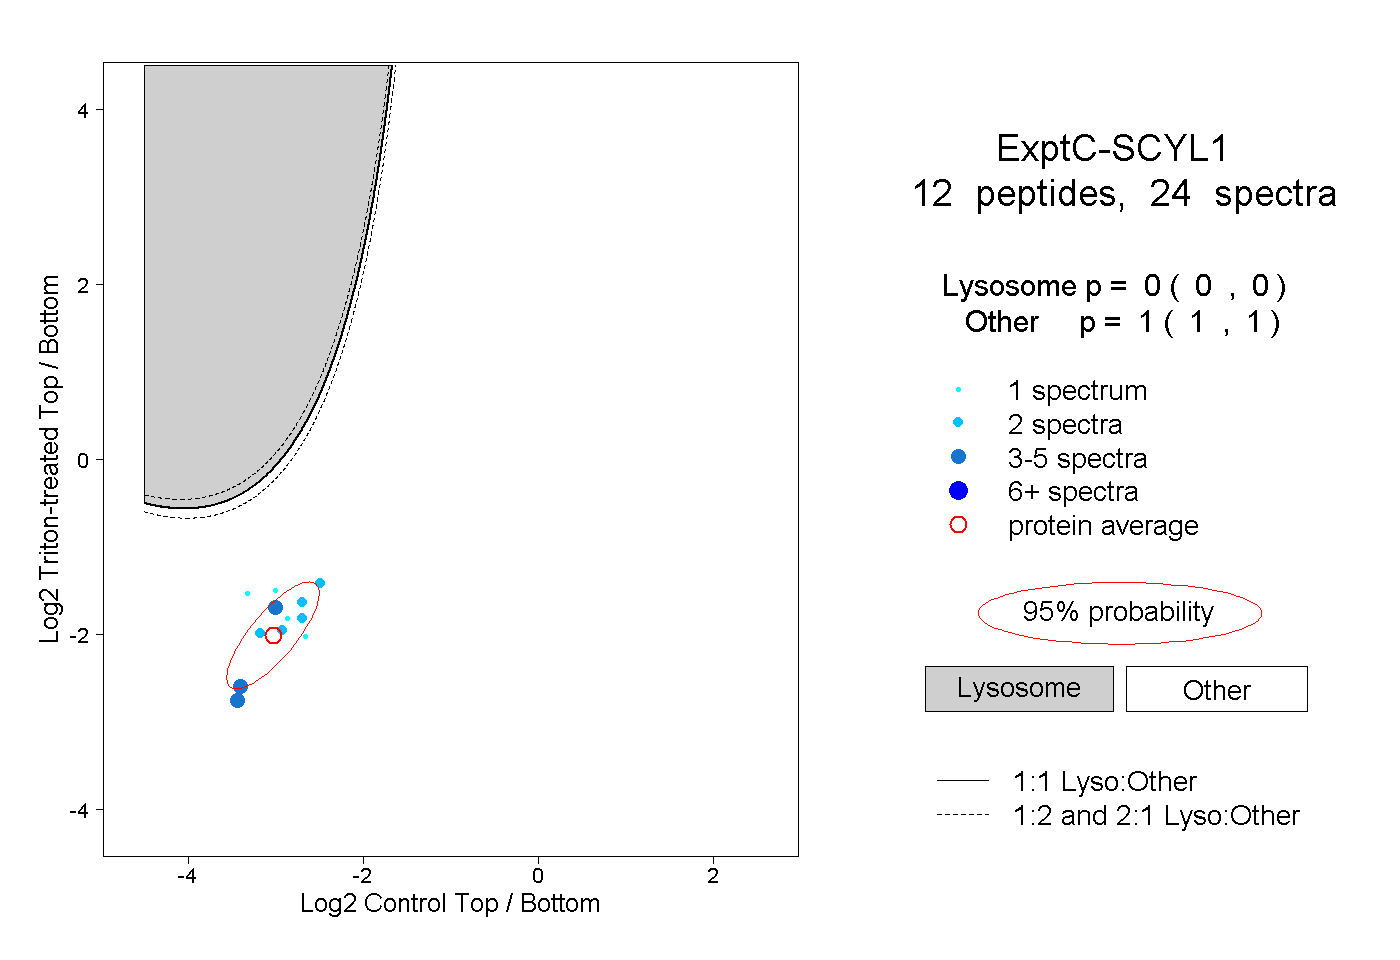
| Expt C |
12
peptides |
24
spectra |
 |
|
0.000
0.000 | 0.000 |
|
|
|
|
|
|
|
1.000
1.000 | 1.000 |