 29
29peptides
spectra
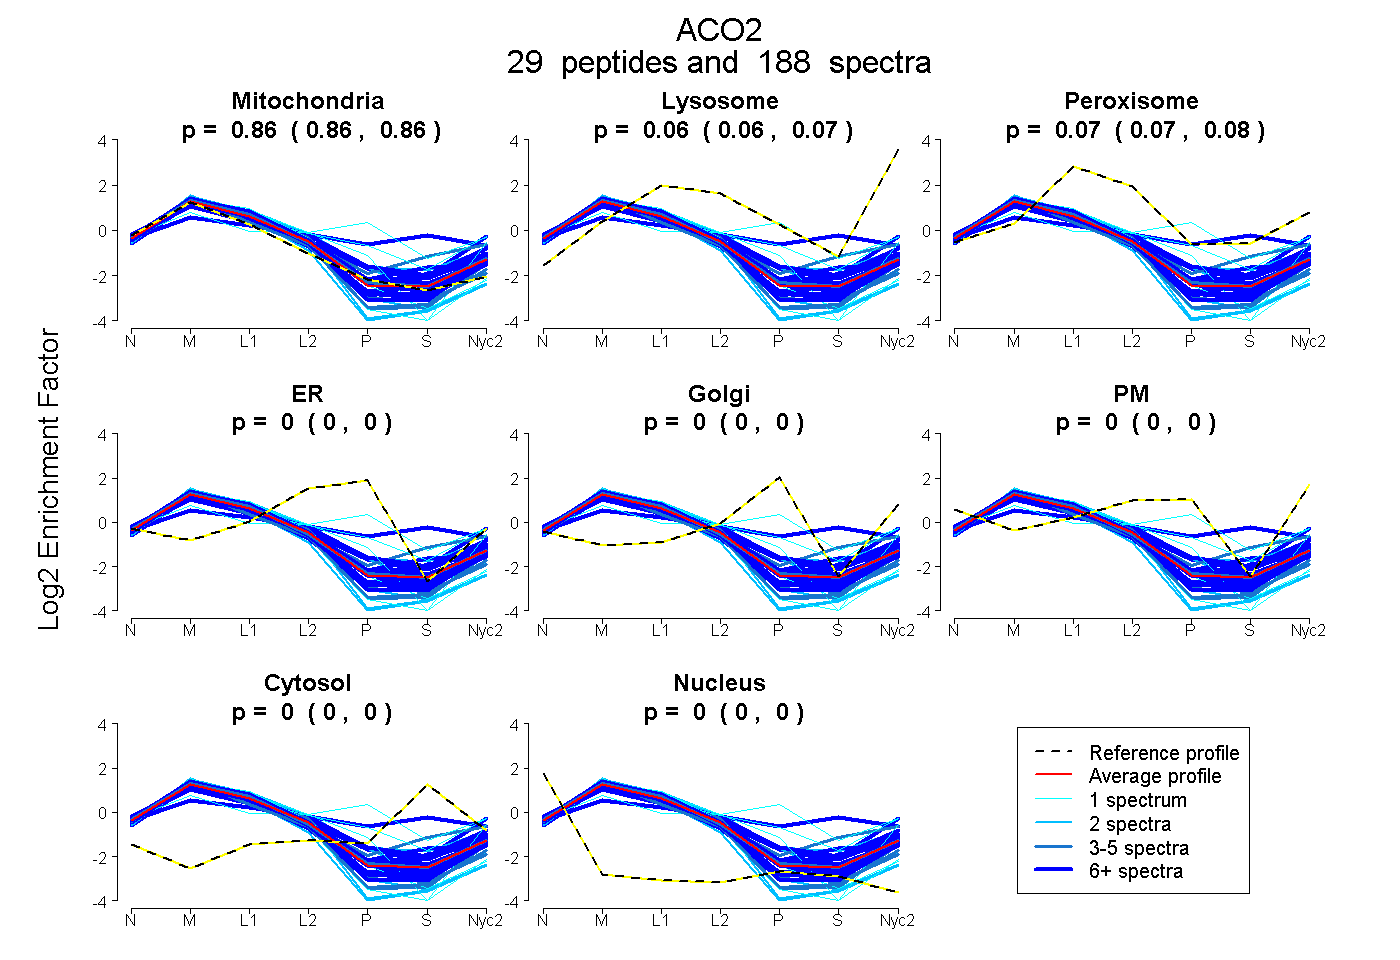
0.860 | 0.864
0.060 | 0.068
0.069 | 0.078
0.000 | 0.000
0.000 | 0.000
0.000 | 0.000
0.000 | 0.000
0.000 | 0.000
25peptides
spectra
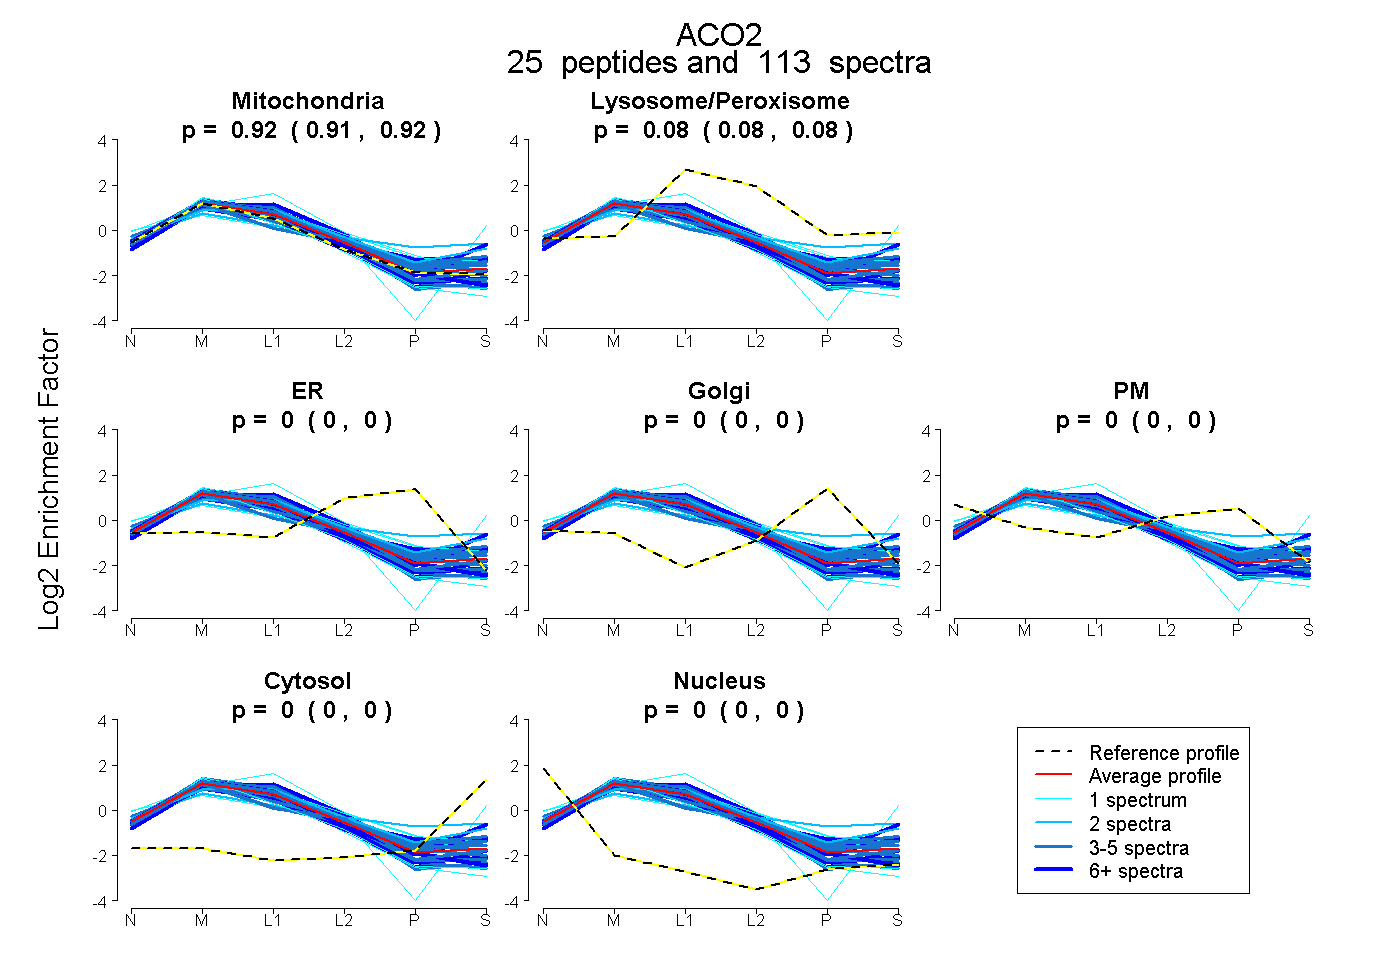
0.913 | 0.921
0.078 | 0.083
0.000 | 0.000
0.000 | 0.000
0.000 | 0.000
0.000 | 0.004
0.000 | 0.000
32peptides
spectra
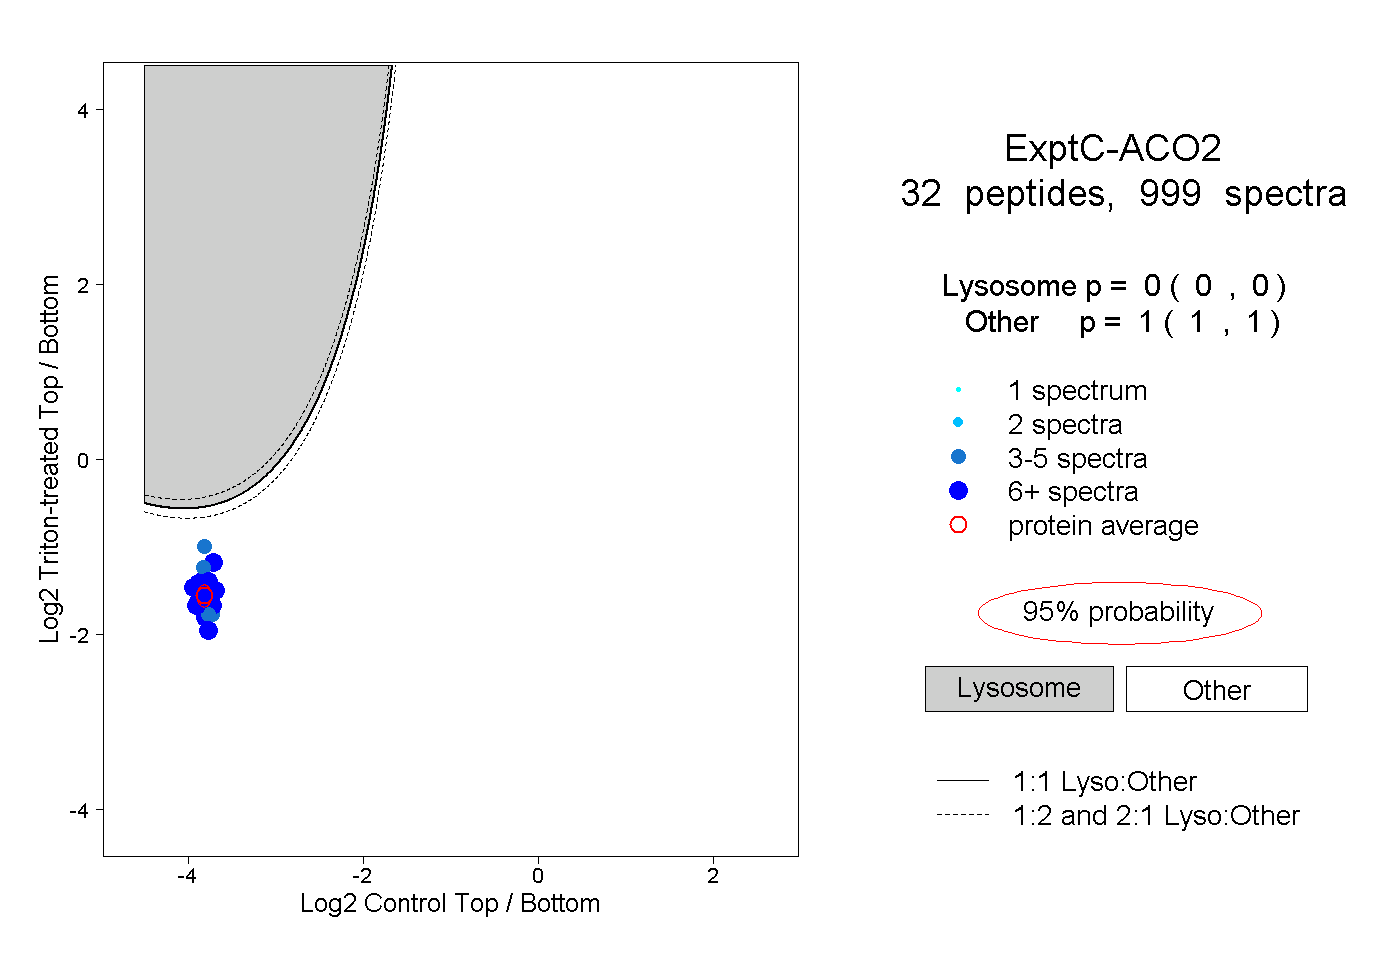
0.000 | 0.000
1.000 | 1.000
19peptides
spectra
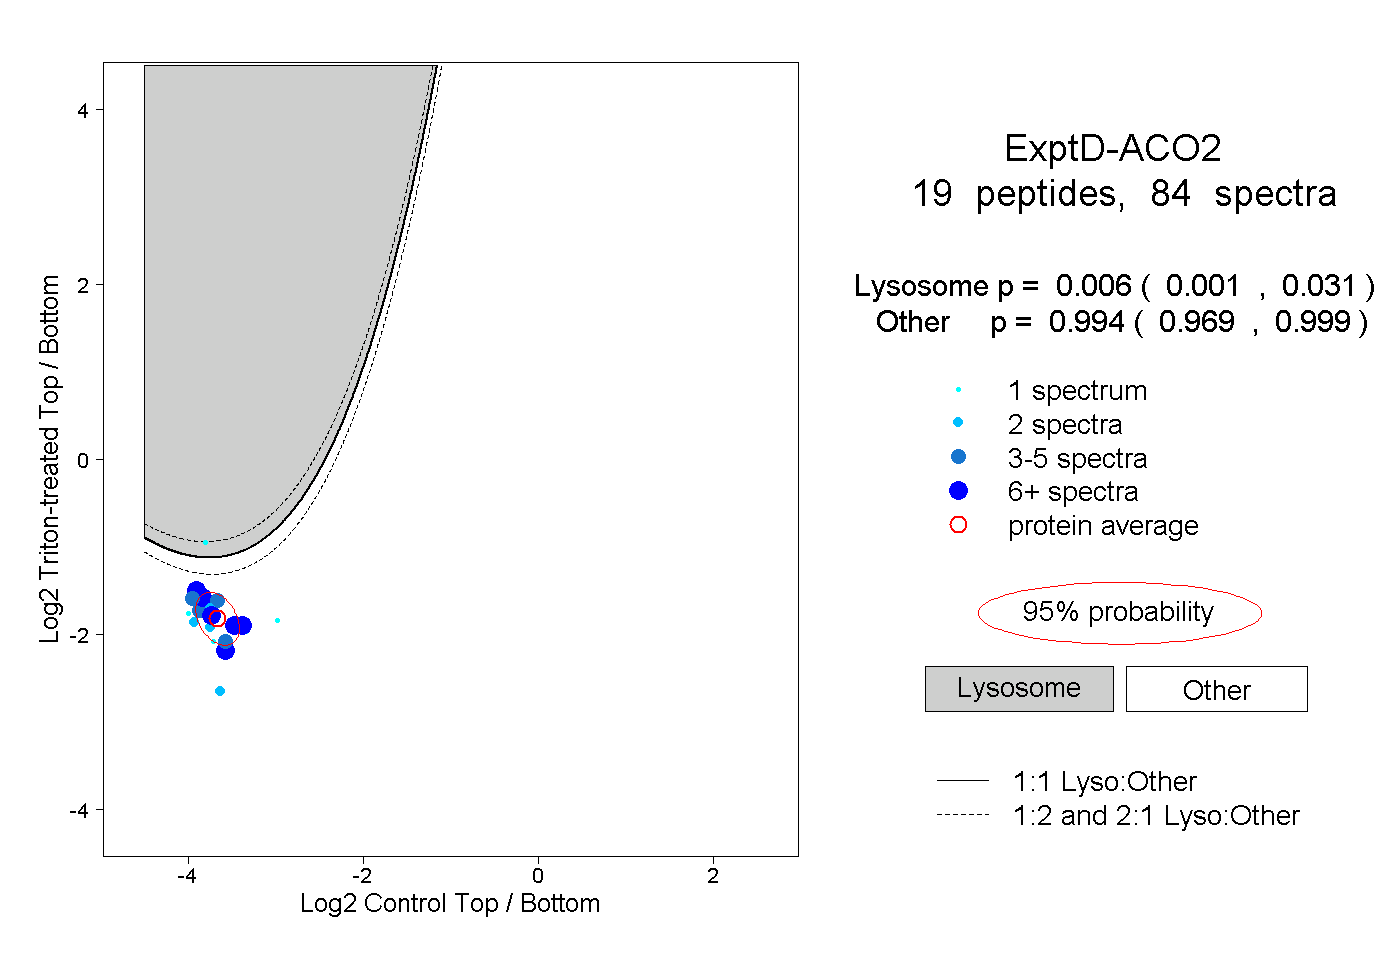
0.001 | 0.031
0.969 | 0.999