 29
29peptides
spectra
0.860 | 0.864
0.060 | 0.068
0.069 | 0.078
0.000 | 0.000
0.000 | 0.000
0.000 | 0.000
0.000 | 0.000
0.000 | 0.000
| Plot | Mito | Lyso | Perox | ER | Golgi | PM | Cytosol | Nucleus | |||||
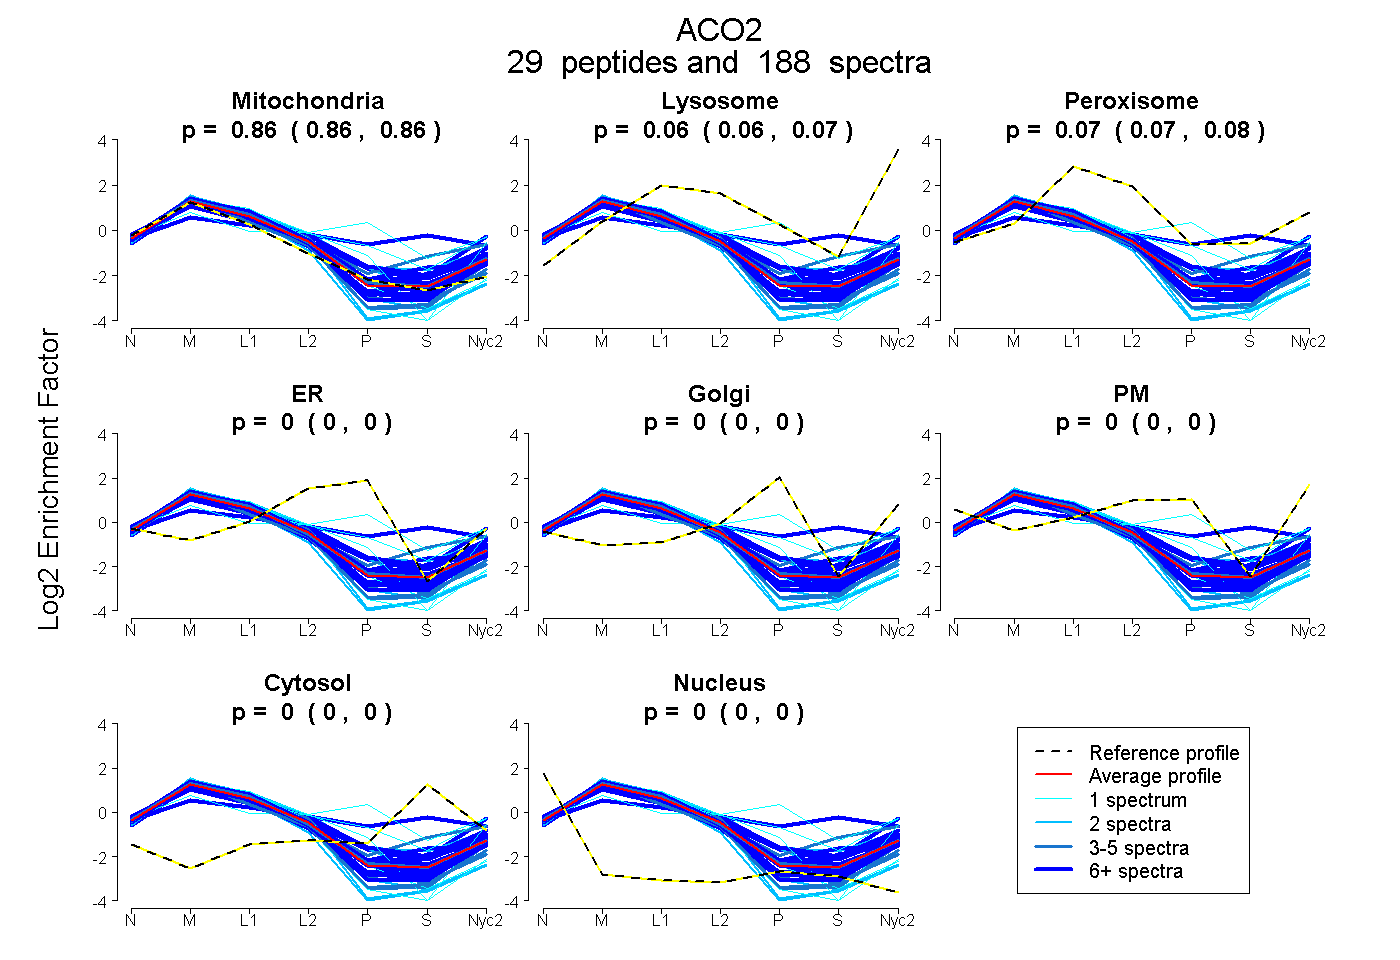
| Expt A |
29 peptides |
188 spectra |
|
0.862 0.860 | 0.864 |
0.064 0.060 | 0.068 |
0.074 0.069 | 0.078 |
0.000 0.000 | 0.000 |
0.000 0.000 | 0.000 |
0.000 0.000 | 0.000 |
0.000 0.000 | 0.000 |
0.000 0.000 | 0.000 |
| 4 spectra, LTIQGLK | 0.971 | 0.000 | 0.029 | 0.000 | 0.000 | 0.000 | 0.000 | 0.000 | ||
| 1 spectrum, LTGTLSGWTSPK | 1.000 | 0.000 | 0.000 | 0.000 | 0.000 | 0.000 | 0.000 | 0.000 | ||
| 10 spectra, SDFDPGQDTYQHPPK | 0.907 | 0.016 | 0.077 | 0.000 | 0.000 | 0.000 | 0.000 | 0.000 | ||
| 7 spectra, DGYAQILR | 0.851 | 0.000 | 0.128 | 0.000 | 0.000 | 0.000 | 0.021 | 0.000 | ||
| 10 spectra, EGWPLDIR | 0.916 | 0.076 | 0.008 | 0.000 | 0.000 | 0.000 | 0.000 | 0.000 | ||
| 2 spectra, IHPVDK | 1.000 | 0.000 | 0.000 | 0.000 | 0.000 | 0.000 | 0.000 | 0.000 | ||
| 4 spectra, YDLLEK | 0.856 | 0.071 | 0.073 | 0.000 | 0.000 | 0.000 | 0.000 | 0.000 | ||
| 1 spectrum, NAVTQEFGPVPDTAR | 0.567 | 0.218 | 0.069 | 0.000 | 0.143 | 0.000 | 0.003 | 0.000 | ||
| 1 spectrum, LDNLVR | 0.330 | 0.000 | 0.213 | 0.000 | 0.409 | 0.000 | 0.048 | 0.000 | ||
| 2 spectra, DFAPGKPLNCIIK | 1.000 | 0.000 | 0.000 | 0.000 | 0.000 | 0.000 | 0.000 | 0.000 | ||
| 2 spectra, LQLLEPFDK | 1.000 | 0.000 | 0.000 | 0.000 | 0.000 | 0.000 | 0.000 | 0.000 | ||
| 7 spectra, LEAPDADELPR | 0.753 | 0.000 | 0.159 | 0.000 | 0.000 | 0.000 | 0.088 | 0.000 | ||
| 2 spectra, DLEDLQILIK | 0.822 | 0.000 | 0.104 | 0.074 | 0.000 | 0.000 | 0.000 | 0.000 | ||
| 1 spectrum, QGLLPLTFADPSDYNK | 0.683 | 0.077 | 0.000 | 0.000 | 0.000 | 0.240 | 0.000 | 0.000 | ||
| 20 spectra, VDVSPTSQR | 0.878 | 0.007 | 0.115 | 0.000 | 0.000 | 0.000 | 0.000 | 0.000 | ||
| 3 spectra, LNRPLTLSEK | 0.975 | 0.025 | 0.000 | 0.000 | 0.000 | 0.000 | 0.000 | 0.000 | ||
| 3 spectra, VAGILTVK | 1.000 | 0.000 | 0.000 | 0.000 | 0.000 | 0.000 | 0.000 | 0.000 | ||
| 6 spectra, ADIANLAEEFK | 0.789 | 0.161 | 0.023 | 0.000 | 0.000 | 0.000 | 0.027 | 0.000 | ||
| 1 spectrum, QALAHGLK | 0.965 | 0.000 | 0.035 | 0.000 | 0.000 | 0.000 | 0.000 | 0.000 | ||
| 2 spectra, CTTDHISAAGPWLK | 0.674 | 0.084 | 0.231 | 0.000 | 0.000 | 0.000 | 0.011 | 0.000 | ||
| 14 spectra, IVYGHLDDPANQEIER | 0.701 | 0.100 | 0.115 | 0.000 | 0.000 | 0.068 | 0.018 | 0.000 | ||
| 14 spectra, NINIVR | 0.808 | 0.130 | 0.031 | 0.000 | 0.000 | 0.000 | 0.031 | 0.000 | ||
| 3 spectra, FNPETDFLTGK | 0.621 | 0.101 | 0.162 | 0.000 | 0.000 | 0.000 | 0.116 | 0.000 | ||
| 6 spectra, SQFTITPGSEQIR | 0.918 | 0.082 | 0.000 | 0.000 | 0.000 | 0.000 | 0.000 | 0.000 | ||
| 11 spectra, AGSALNR | 0.784 | 0.216 | 0.000 | 0.000 | 0.000 | 0.000 | 0.000 | 0.000 | ||
| 11 spectra, VAMSHFEPSEYIR | 0.844 | 0.047 | 0.109 | 0.000 | 0.000 | 0.000 | 0.000 | 0.000 | ||
| 7 spectra, EHAALEPR | 0.328 | 0.000 | 0.310 | 0.000 | 0.097 | 0.000 | 0.265 | 0.000 | ||
| 11 spectra, WVVIGDENYGEGSSR | 0.904 | 0.094 | 0.002 | 0.000 | 0.000 | 0.000 | 0.000 | 0.000 | ||
| 22 spectra, NTIVTSYNR | 0.908 | 0.092 | 0.000 | 0.000 | 0.000 | 0.000 | 0.000 | 0.000 |
| Plot | Mito | Lyso or Perox | ER | Golgi | PM | Cytosol | Nucleus | ||||||
| Expt B |
25 peptides |
113 spectra |
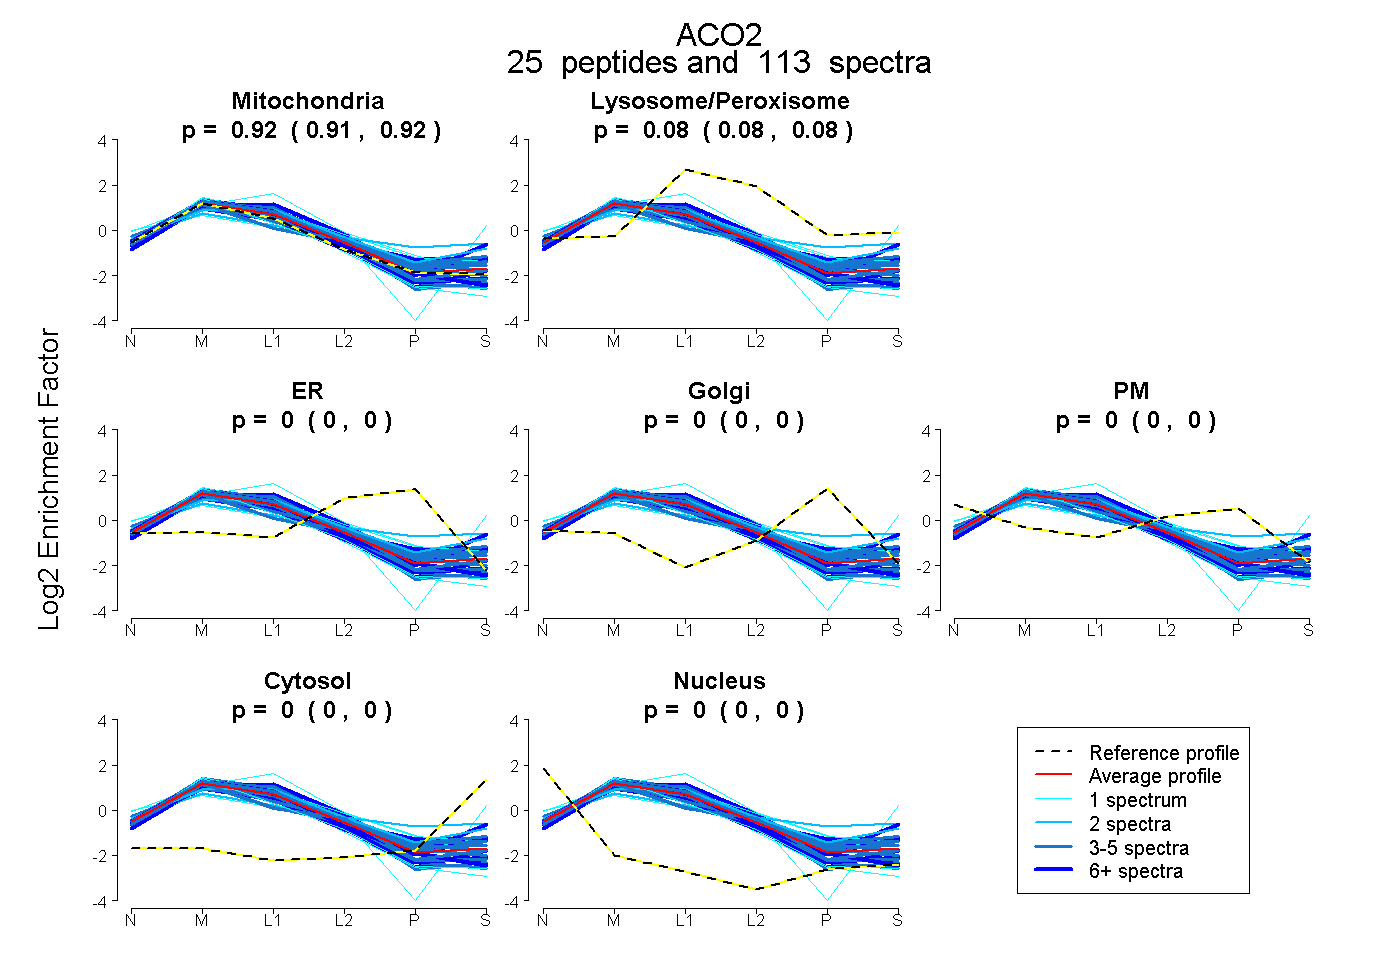 |
0.918 0.913 | 0.921 |
0.081 0.078 | 0.083 |
0.000 0.000 | 0.000 |
0.000 0.000 | 0.000 |
0.000 0.000 | 0.000 |
0.001 0.000 | 0.004 |
0.000 0.000 | 0.000 |
|||
| Plot | Lyso | Other | |||||||||||
| Expt C |
32 peptides |
999 spectra |
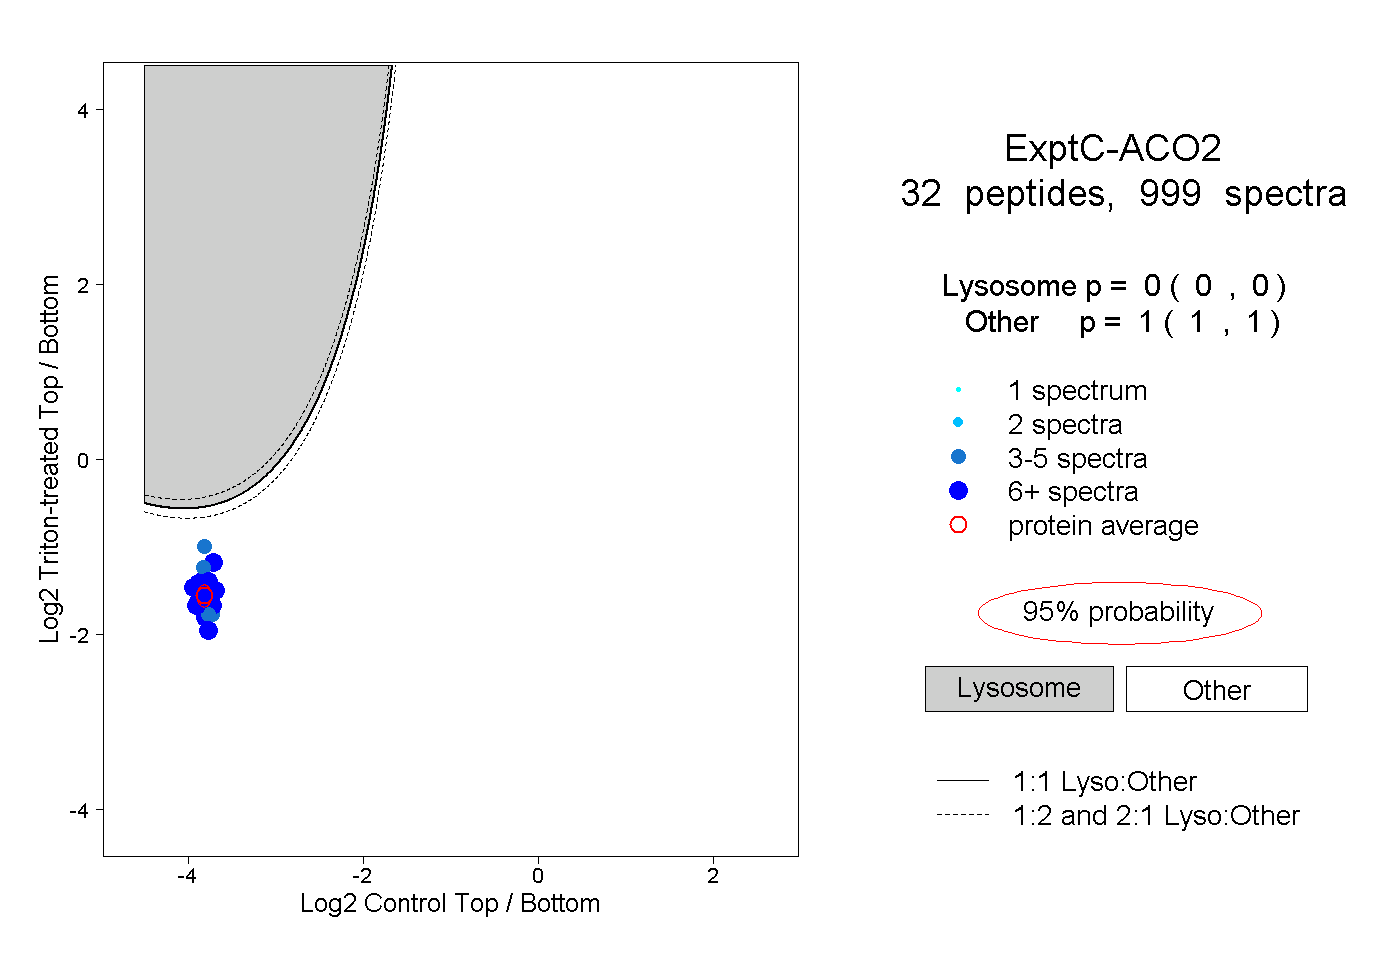 |
0.000 0.000 | 0.000 |
1.000 1.000 | 1.000 |
||||||||
| Plot | Lyso | Other | |||||||||||
| Expt D |
19 peptides |
84 spectra |
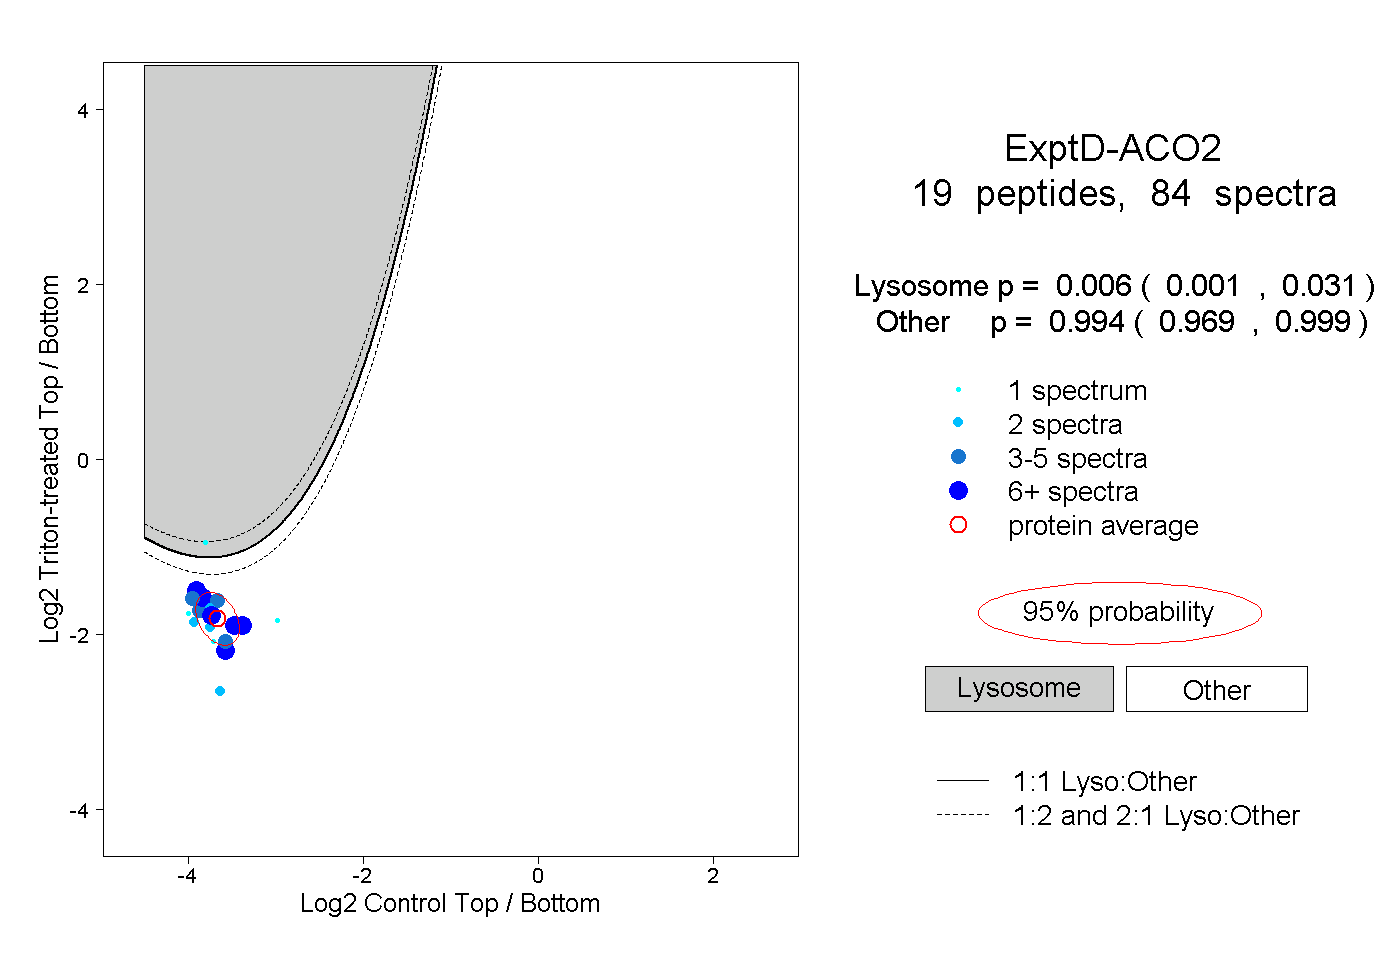 |
0.006 0.001 | 0.031 |
0.994 0.969 | 0.999 |