 11
11peptides
spectra
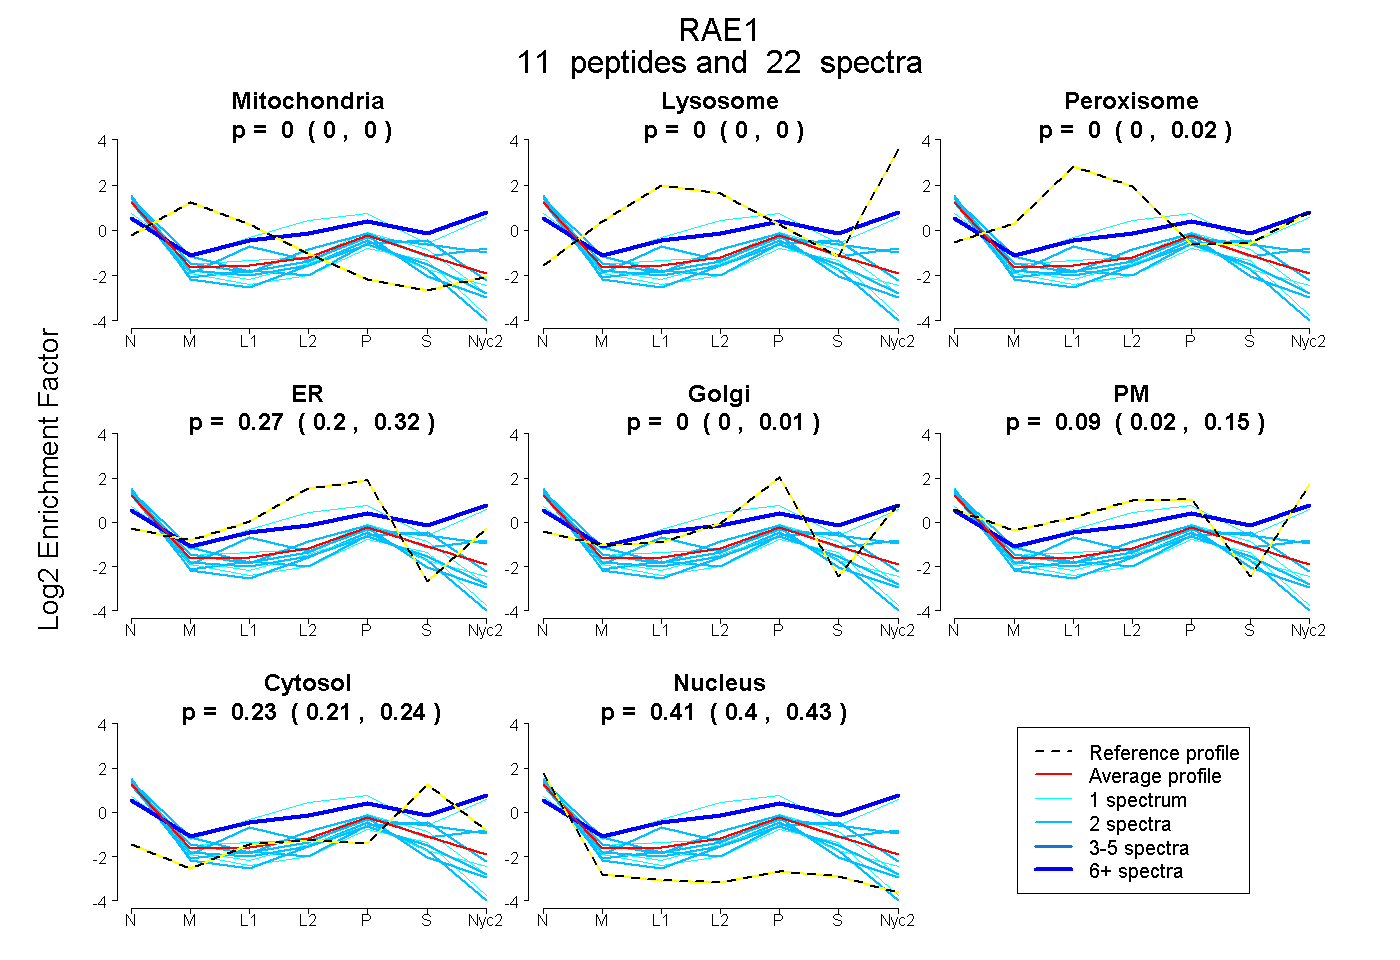
0.000 | 0.000
0.000 | 0.000
0.000 | 0.019
0.201 | 0.318
0.000 | 0.007
0.016 | 0.148
0.208 | 0.240
0.395 | 0.426
2peptides
spectra
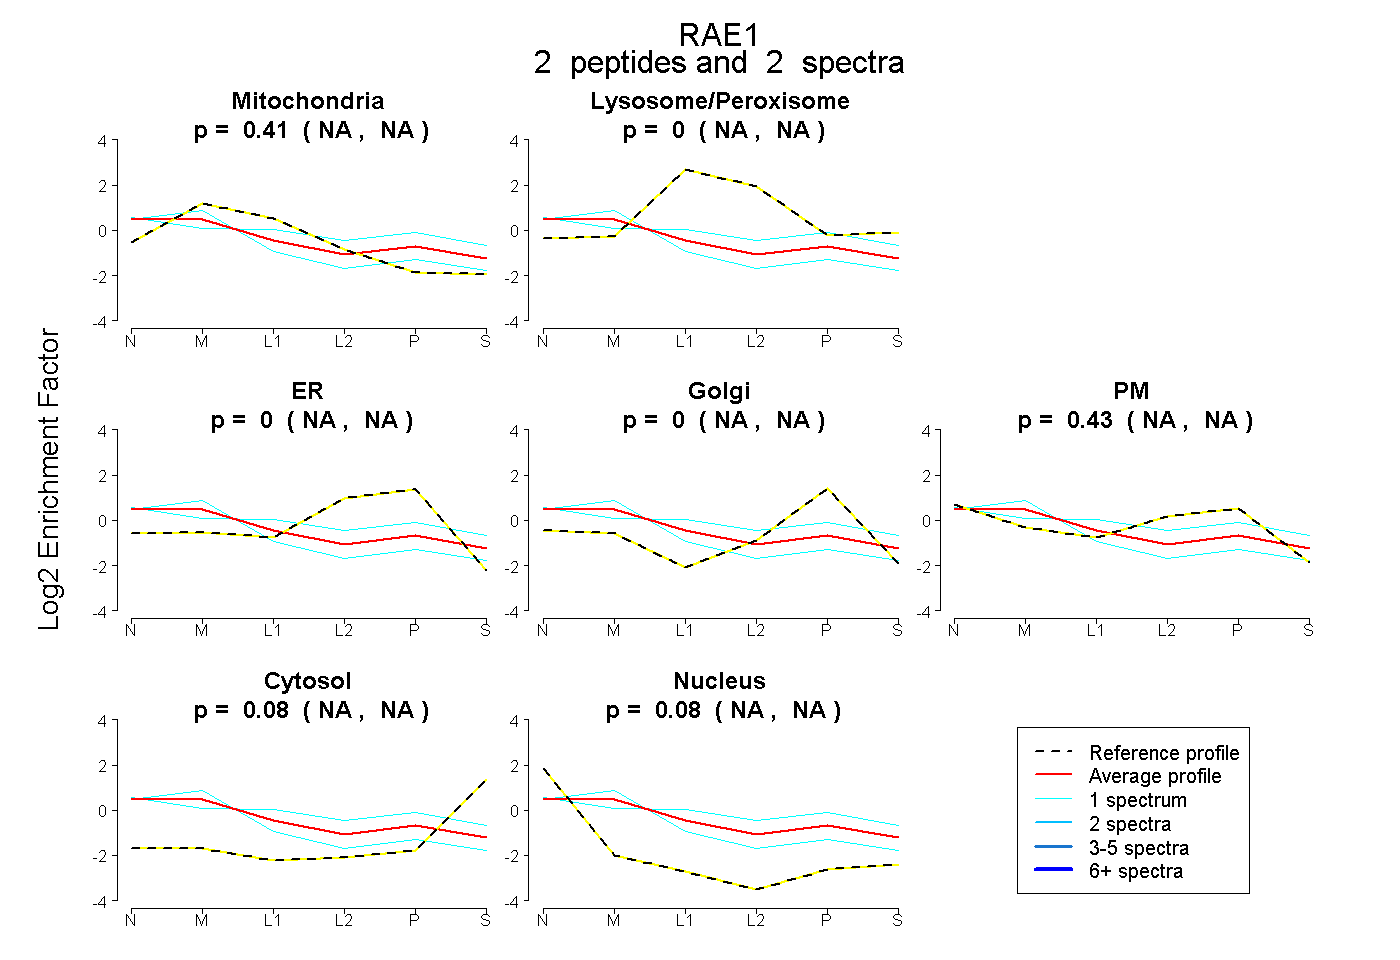
NA | NA
NA | NA
NA | NA
NA | NA
NA | NA
NA | NA
NA | NA
2peptides
spectra
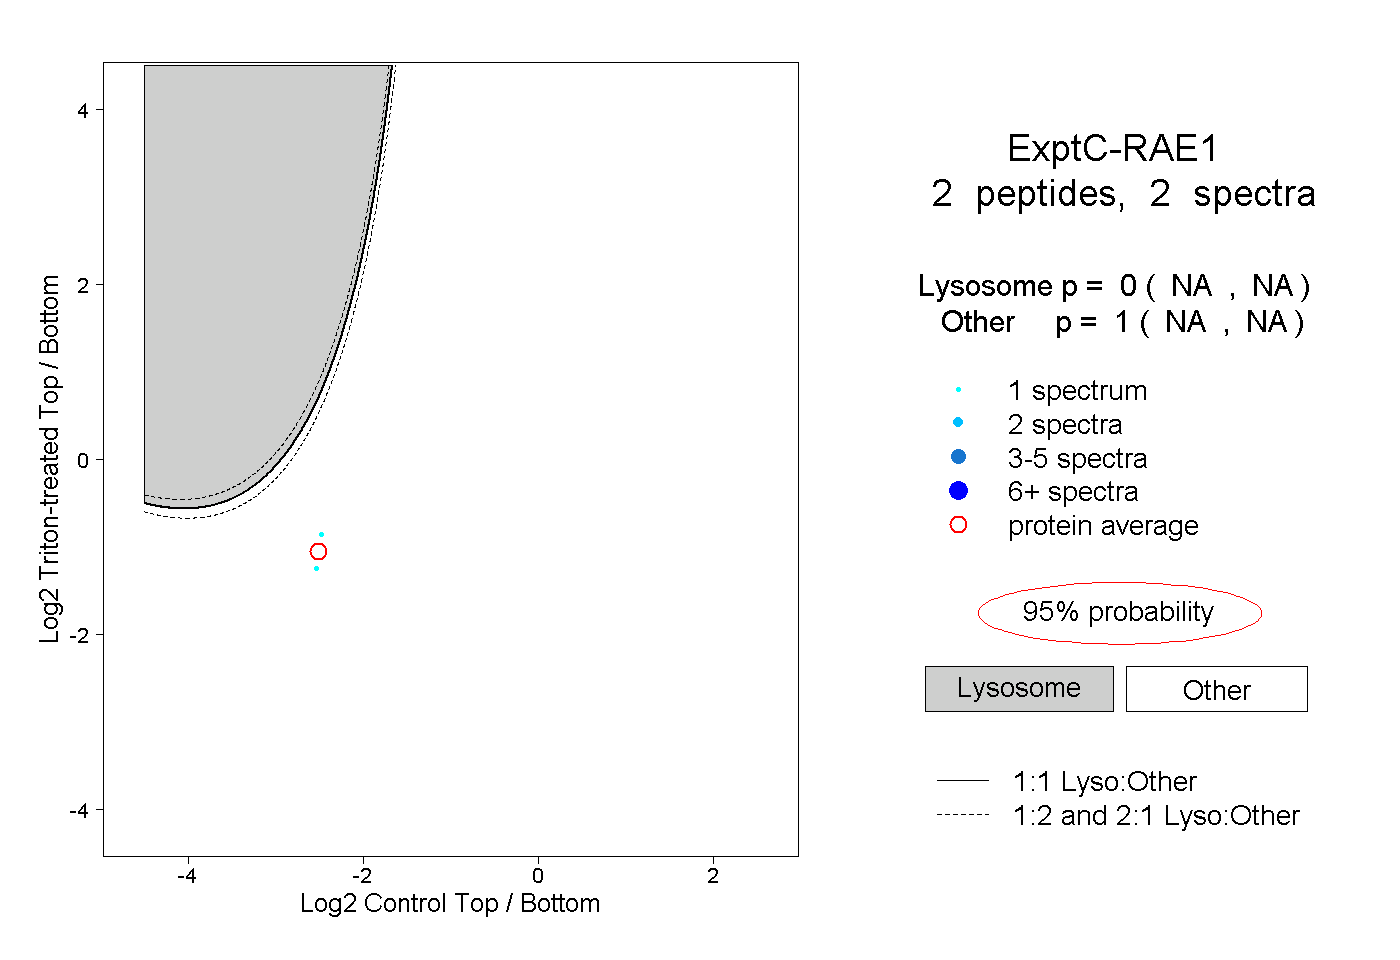
NA | NA
NA | NA