 11
11peptides
spectra
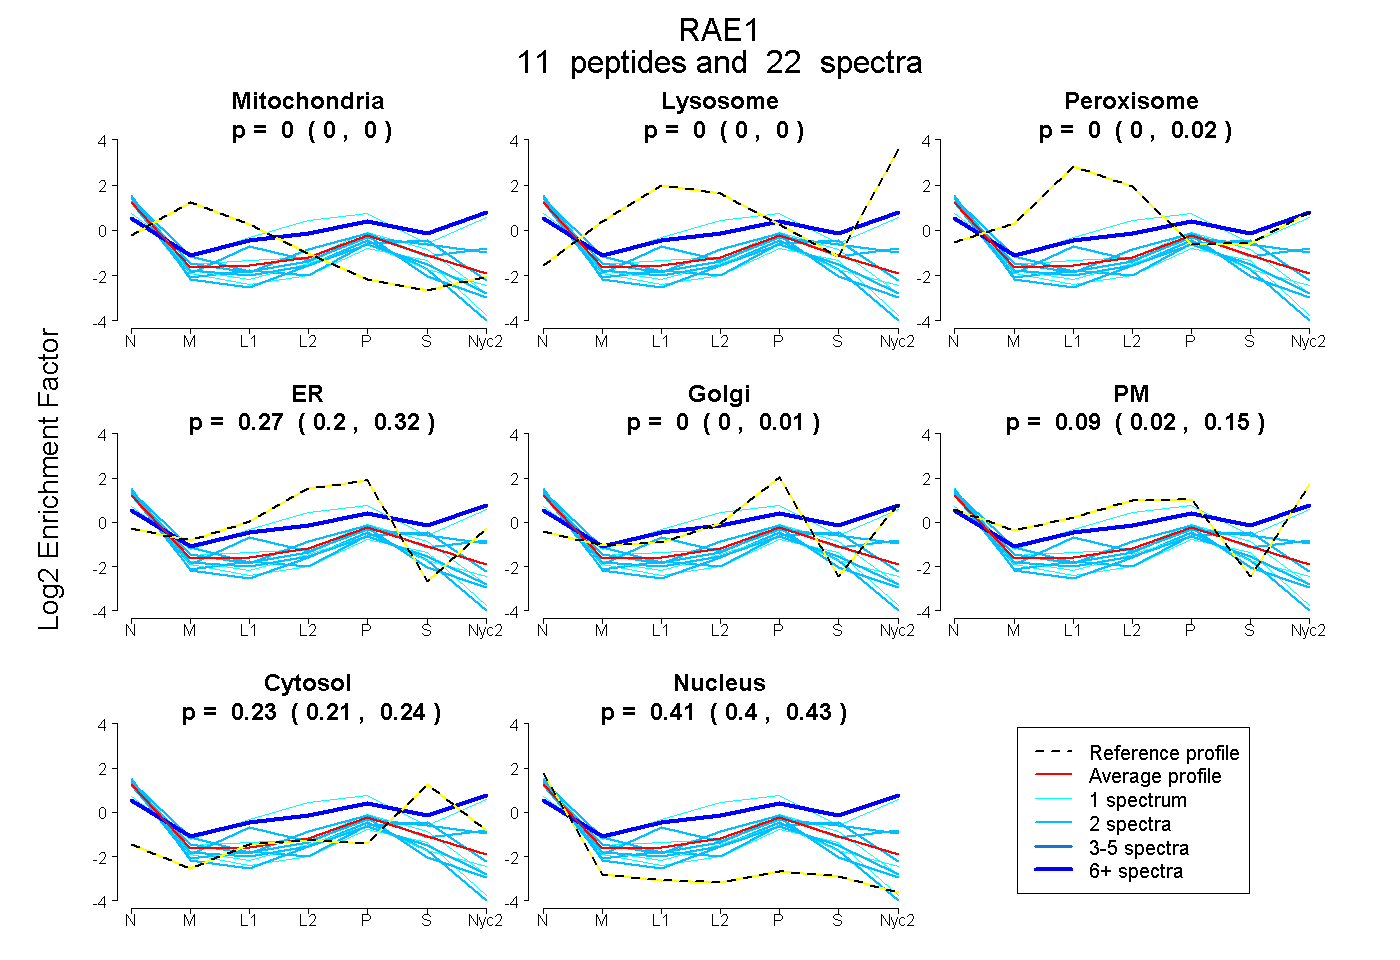
0.000 | 0.000
0.000 | 0.000
0.000 | 0.019
0.201 | 0.318
0.000 | 0.007
0.016 | 0.148
0.208 | 0.240
0.395 | 0.426
| Plot | Mito | Lyso | Perox | ER | Golgi | PM | Cytosol | Nucleus | |||||
| Expt A |
11 peptides |
22 spectra |
|
0.000 0.000 | 0.000 |
0.000 0.000 | 0.000 |
0.000 0.000 | 0.019 |
0.269 0.201 | 0.318 |
0.000 0.000 | 0.007 |
0.093 0.016 | 0.148 |
0.227 0.208 | 0.240 |
0.411 0.395 | 0.426 |
| 1 spectrum, QNKPTGFALGSIEGR | 0.000 | 0.000 | 0.000 | 0.296 | 0.000 | 0.022 | 0.107 | 0.575 | ||
| 6 spectra, VAIHYINPPNPAK | 0.000 | 0.000 | 0.000 | 0.000 | 0.000 | 0.583 | 0.417 | 0.000 | ||
| 1 spectrum, FSFWDK | 0.000 | 0.000 | 0.000 | 0.182 | 0.000 | 0.000 | 0.139 | 0.679 | ||
| 1 spectrum, APNYSCVMTGSWDK | 0.000 | 0.000 | 0.000 | 0.061 | 0.000 | 0.616 | 0.323 | 0.000 | ||
| 2 spectra, VFTASCDK | 0.000 | 0.000 | 0.000 | 0.290 | 0.000 | 0.000 | 0.133 | 0.578 | ||
| 2 spectra, CVAIFK | 0.000 | 0.000 | 0.066 | 0.000 | 0.000 | 0.316 | 0.312 | 0.306 | ||
| 2 spectra, TIHWIK | 0.071 | 0.000 | 0.000 | 0.373 | 0.000 | 0.000 | 0.000 | 0.556 | ||
| 2 spectra, NYIFLR | 0.000 | 0.000 | 0.000 | 0.000 | 0.099 | 0.357 | 0.206 | 0.338 | ||
| 2 spectra, GLIVYQLENQPSEFR | 0.000 | 0.000 | 0.000 | 0.092 | 0.069 | 0.023 | 0.370 | 0.445 | ||
| 2 spectra, NAAEELKPR | 0.000 | 0.000 | 0.000 | 0.255 | 0.000 | 0.000 | 0.043 | 0.702 | ||
| 1 spectrum, AQQMHTGPVLDVCWSDDGSK | 0.000 | 0.000 | 0.035 | 0.311 | 0.000 | 0.000 | 0.212 | 0.441 |
| Plot | Mito | Lyso or Perox | ER | Golgi | PM | Cytosol | Nucleus | ||||||
| Expt B |
2 peptides |
2 spectra |
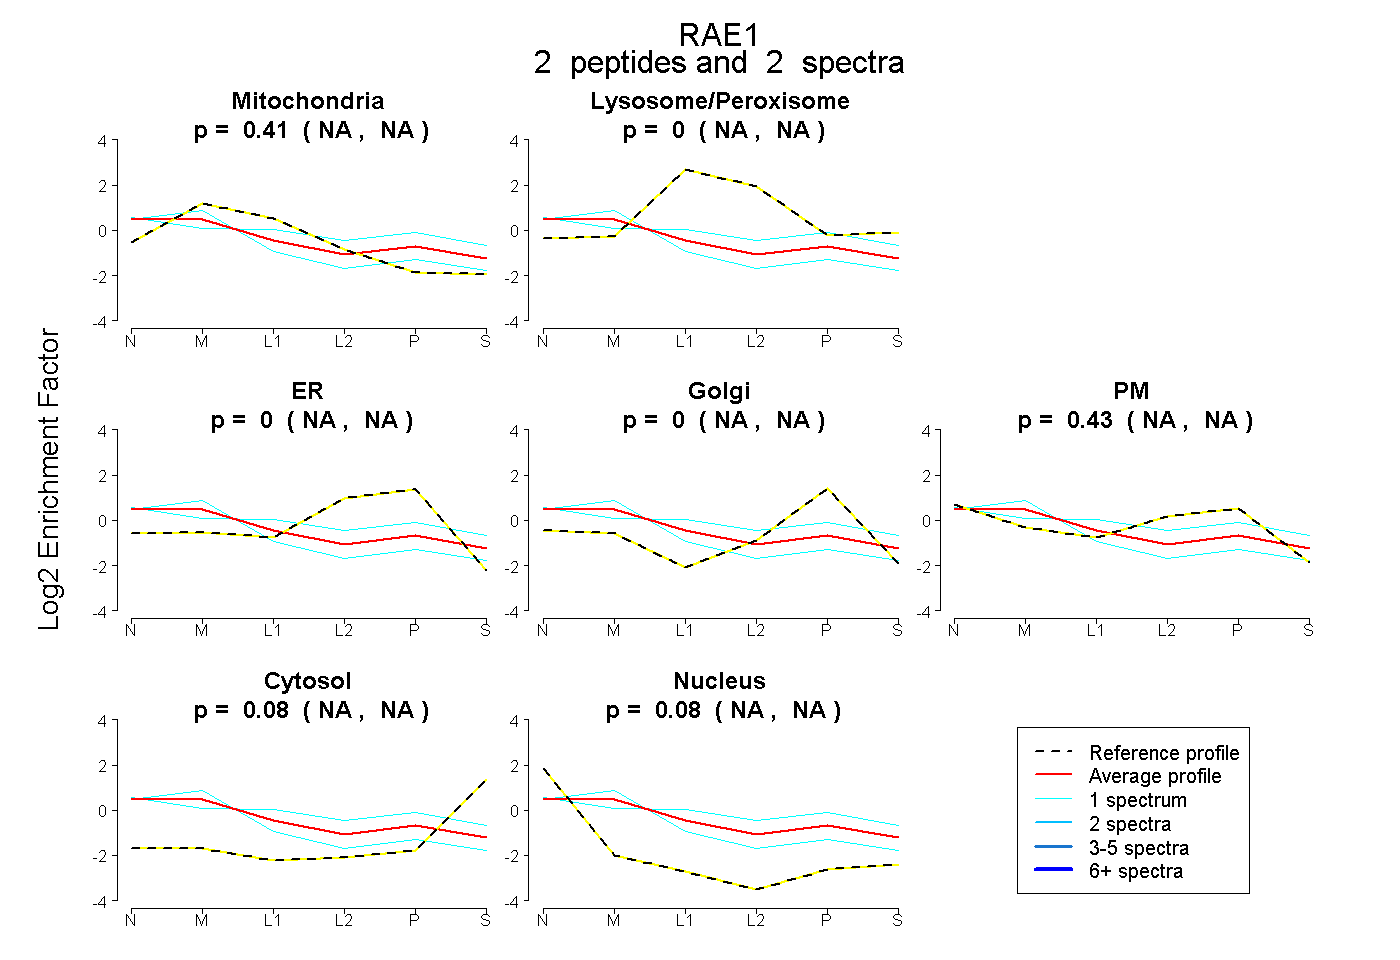 |
0.410 NA | NA |
0.000 NA | NA |
0.000 NA | NA |
0.000 NA | NA |
0.425 NA | NA |
0.083 NA | NA |
0.082 NA | NA |
|||
| Plot | Lyso | Other | |||||||||||
| Expt C |
2 peptides |
2 spectra |
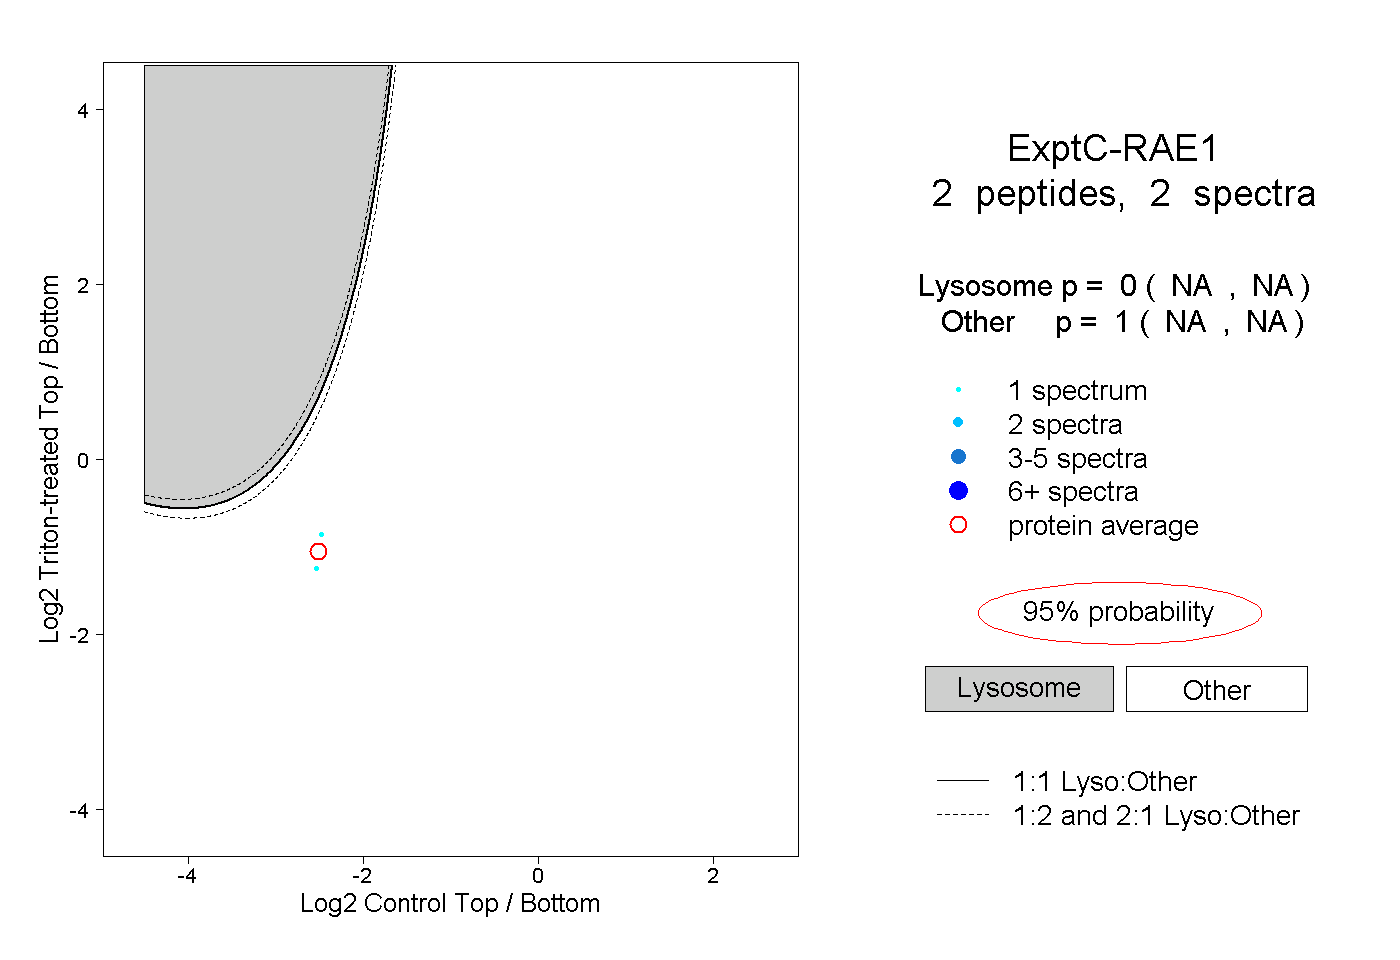 |
0.000 NA | NA |
1.000 NA | NA |