 11
11peptides
spectra
0.000 | 0.000
0.000 | 0.000
0.000 | 0.019
0.201 | 0.318
0.000 | 0.007
0.016 | 0.148
0.208 | 0.240
0.395 | 0.426
2peptides
spectra
NA | NA
NA | NA
NA | NA
NA | NA
NA | NA
NA | NA
NA | NA
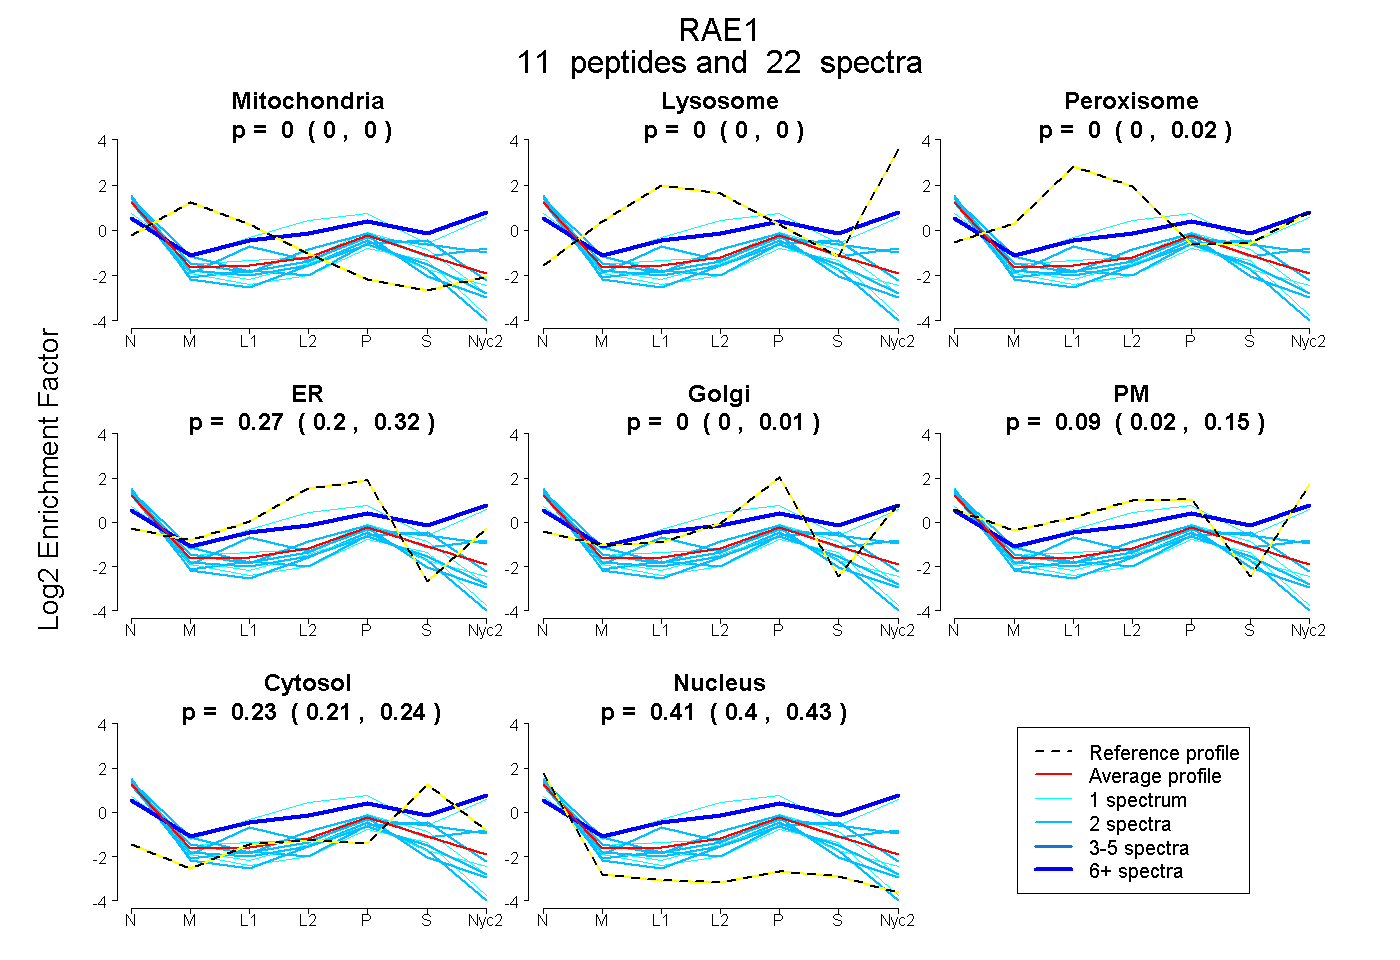
| Plot | Mito | Lyso | Perox | ER | Golgi | PM | Cytosol | Nucleus | |||||
| Expt A |
11 peptides |
22 spectra |
|
0.000 0.000 | 0.000 |
0.000 0.000 | 0.000 |
0.000 0.000 | 0.019 |
0.269 0.201 | 0.318 |
0.000 0.000 | 0.007 |
0.093 0.016 | 0.148 |
0.227 0.208 | 0.240 |
0.411 0.395 | 0.426 |
||
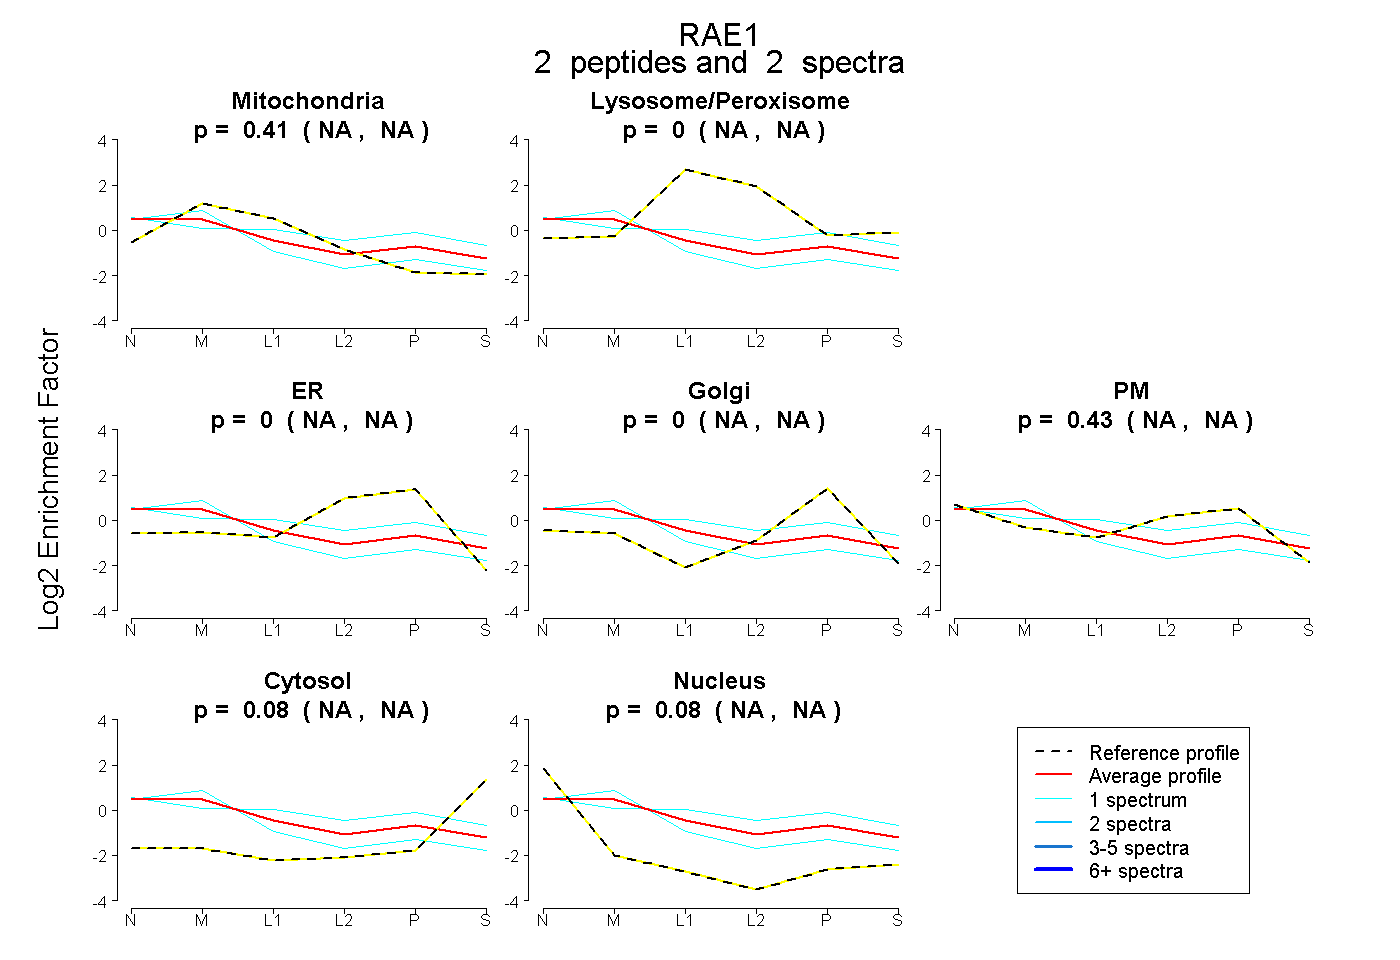
| Plot | Mito | Lyso or Perox | ER | Golgi | PM | Cytosol | Nucleus | ||||||
| Expt B |
2 peptides |
2 spectra |
|
0.410 NA | NA |
0.000 NA | NA |
0.000 NA | NA |
0.000 NA | NA |
0.425 NA | NA |
0.083 NA | NA |
0.082 NA | NA |
| 1 spectrum, VAIHYINPPNPAK | 0.135 | 0.207 | 0.000 | 0.000 | 0.499 | 0.115 | 0.044 | |||
| 1 spectrum, NYIFLR | 0.596 | 0.000 | 0.000 | 0.174 | 0.000 | 0.000 | 0.231 |
| Plot | Lyso | Other | |||||||||||
| Expt C |
2 peptides |
2 spectra |
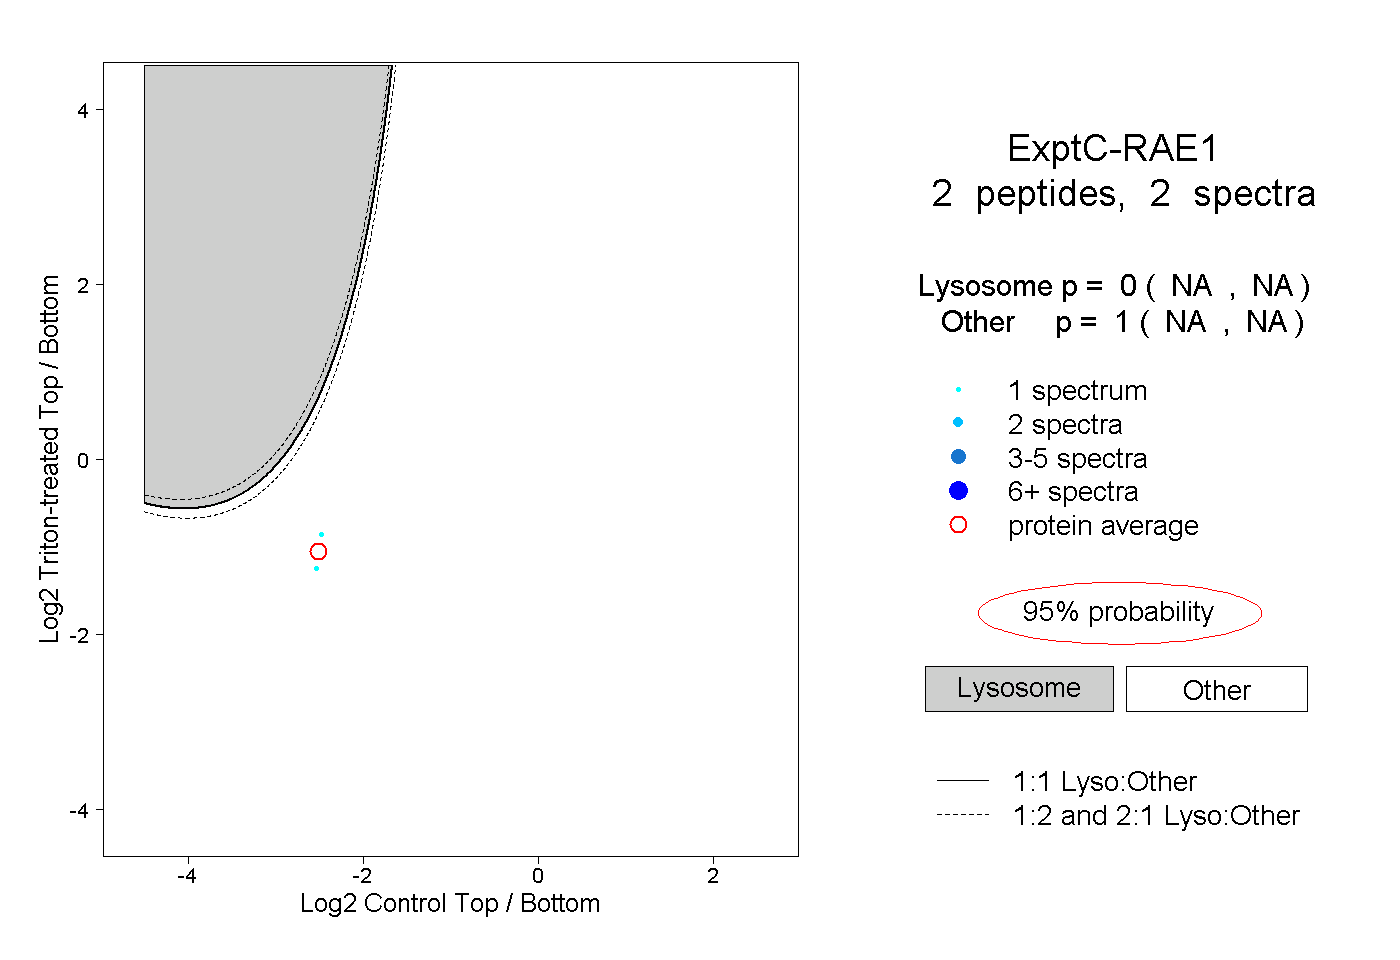 |
0.000 NA | NA |
1.000 NA | NA |