 19
19peptides
spectra
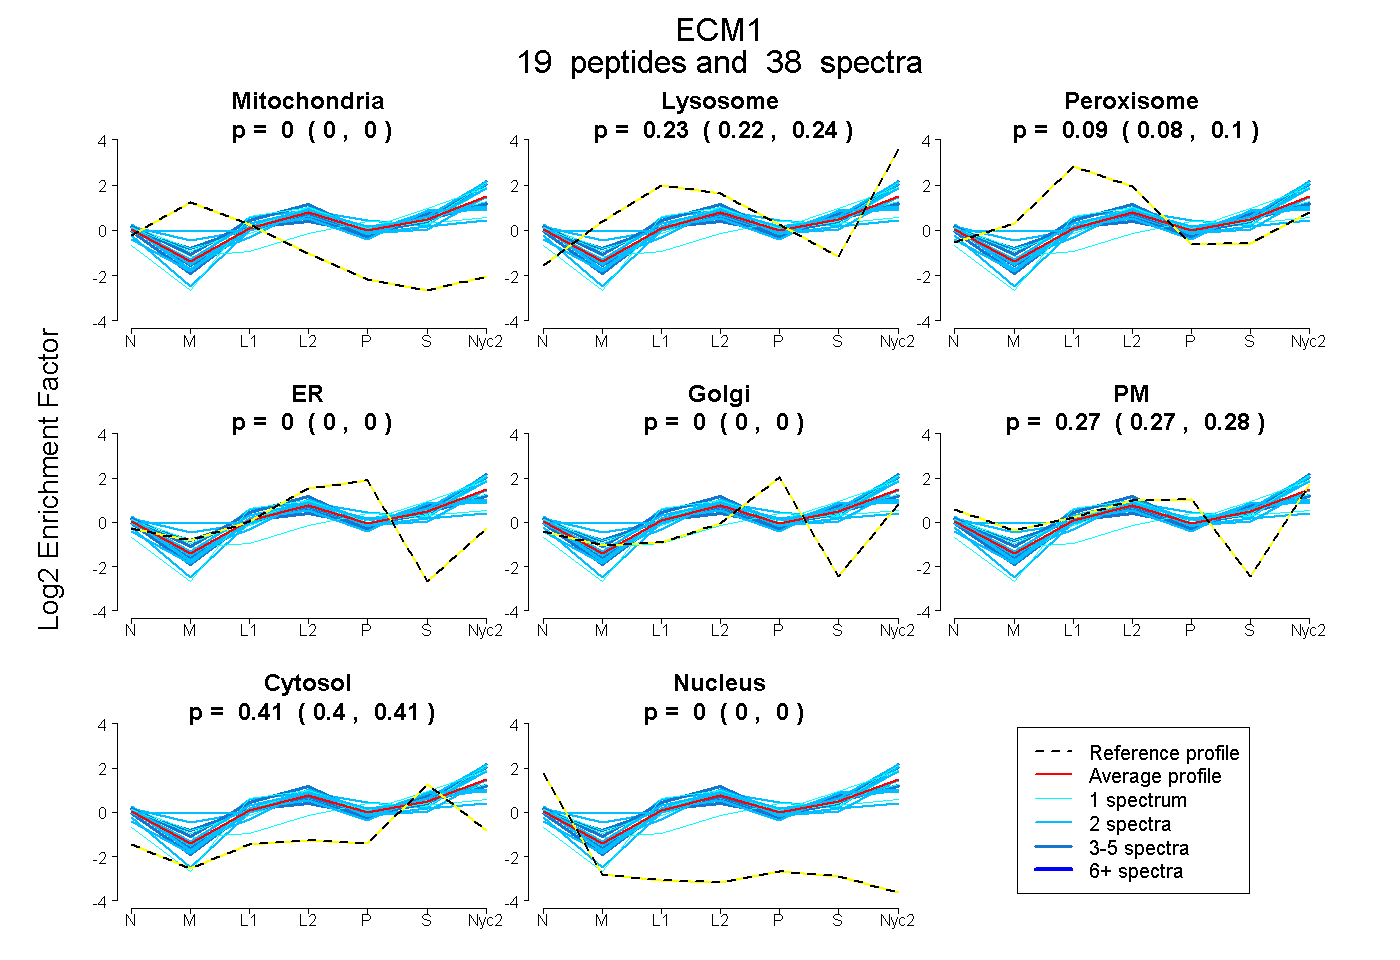
0.000 | 0.000
0.222 | 0.244
0.079 | 0.098
0.000 | 0.000
0.000 | 0.000
0.265 | 0.276
0.401 | 0.409
0.000 | 0.000
5peptides
spectra

0.000 | 0.000
0.203 | 0.268
0.000 | 0.000
0.000 | 0.000
0.306 | 0.360
0.409 | 0.434
0.000 | 0.008
18peptides
spectra
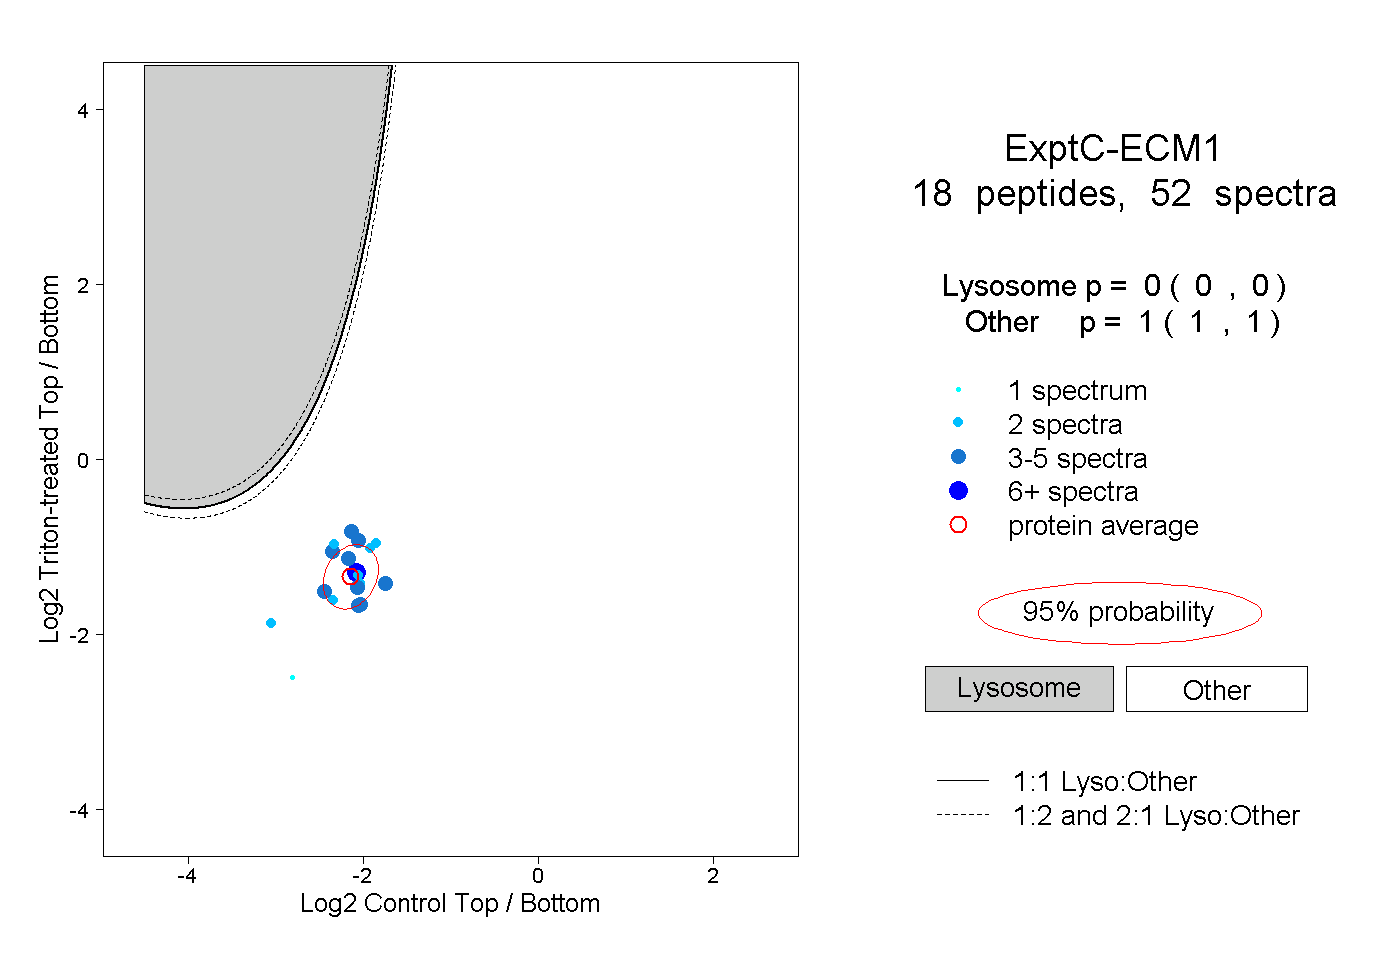
0.000 | 0.000
1.000 | 1.000
3peptides
spectra
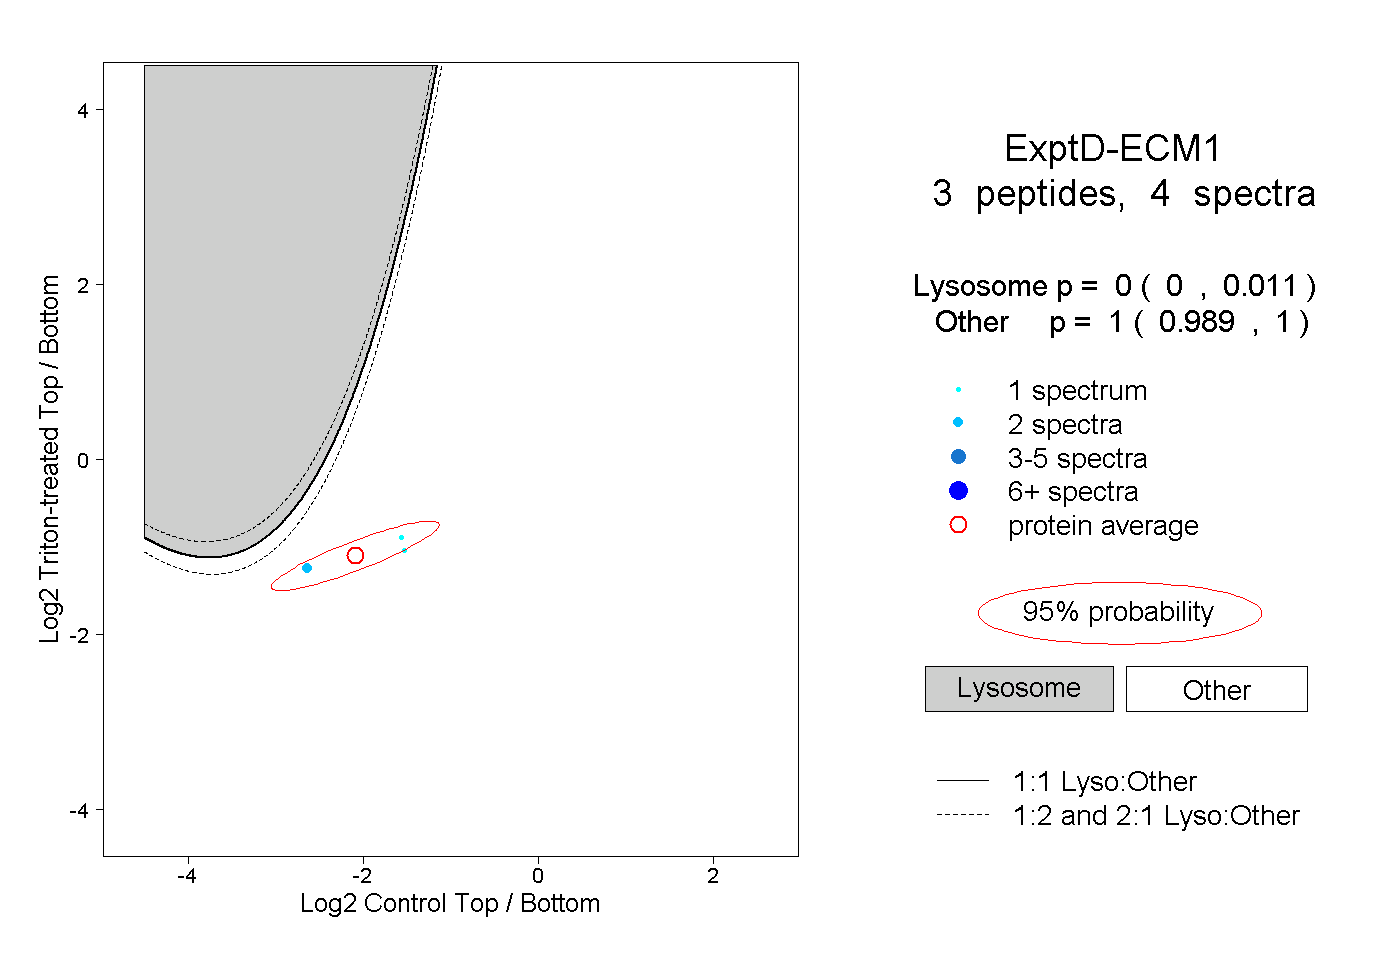
0.000 | 0.011
0.989 | 1.000