ECM1
[ENSRNOP00000028740]
Main page
| | | Plot |
Mito |
Lyso |
|
Perox |
ER |
Golgi |
PM |
Cytosol |
Nucleus |
|
| Expt A |
 19
19
peptides |
38
spectra |
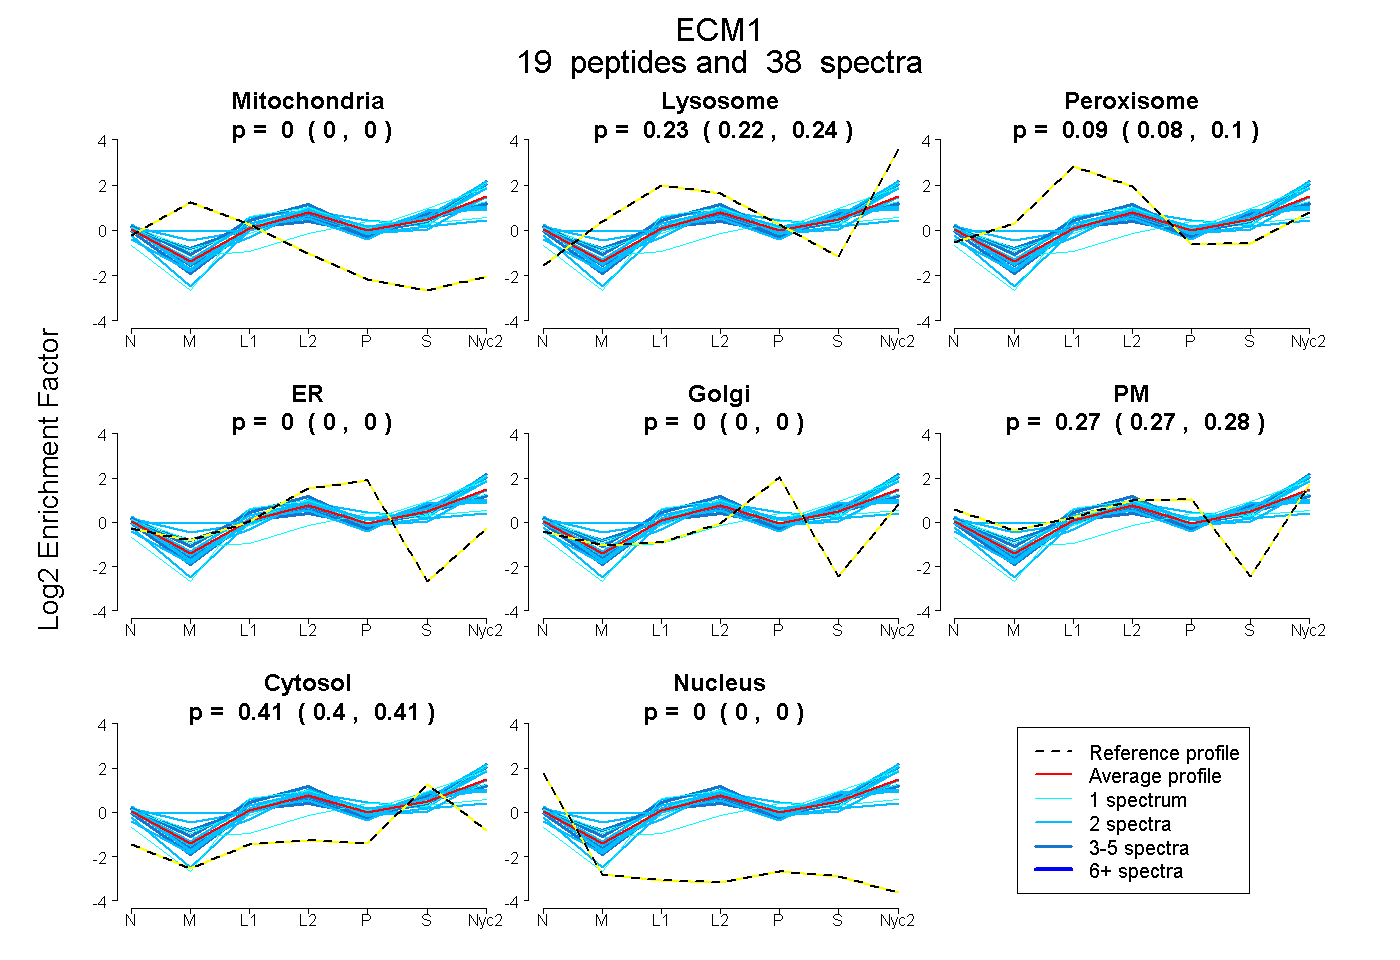 |
0.000
0.000 | 0.000 |
0.234
0.222 | 0.244 |
|
0.089
0.079 | 0.098 |
0.000
0.000 | 0.000 |
0.000
0.000 | 0.000 |
0.271
0.265 | 0.276 |
0.406
0.401 | 0.409 |
0.000
0.000 | 0.000 |
|
| | | Plot |
Mito |
|
Lyso or Perox |
|
ER |
Golgi |
PM |
Cytosol |
Nucleus |
|
| Expt B |
5
peptides |
8
spectra |
 |
0.000
0.000 | 0.000 |
|
0.235
0.203 | 0.268 |
|
0.000
0.000 | 0.000 |
0.000
0.000 | 0.000 |
0.341
0.306 | 0.360 |
0.424
0.409 | 0.434 |
0.000
0.000 | 0.008 |
|
| 2 spectra, LETEFQR |
0.000 |
|
0.172 |
|
0.000 |
0.000 |
0.367 |
0.461 |
0.000 |
|
| 1 spectrum, QICLPER |
0.000 |
|
0.389 |
|
0.000 |
0.000 |
0.262 |
0.327 |
0.022 |
|
| 2 spectra, NICLLR |
0.000 |
|
0.145 |
|
0.000 |
0.000 |
0.366 |
0.489 |
0.000 |
|
| 2 spectra, QLQALTR |
0.000 |
|
0.149 |
|
0.000 |
0.000 |
0.418 |
0.432 |
0.000 |
|
| 1 spectrum, NLPATDAIQR |
0.000 |
|
0.354 |
|
0.000 |
0.000 |
0.242 |
0.380 |
0.023 |
|
| | | Plot |
|
Lyso |
|
|
|
|
|
|
|
Other |
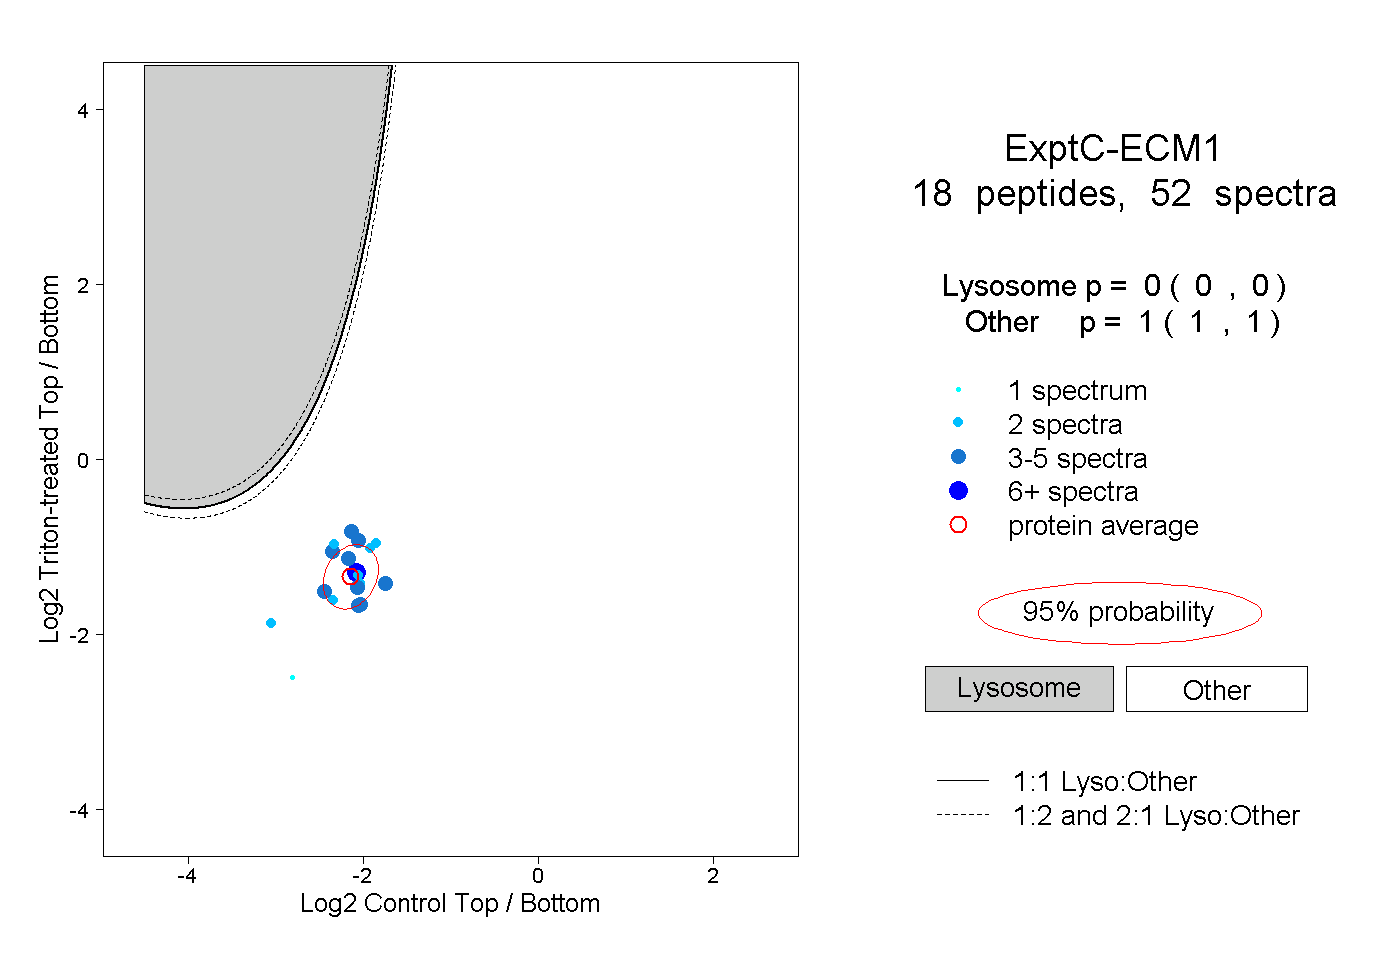
| Expt C |
18
peptides |
52
spectra |
 |
|
0.000
0.000 | 0.000 |
|
|
|
|
|
|
|
1.000
1.000 | 1.000 |
| | | Plot |
|
Lyso |
|
|
|
|
|
|
|
Other |
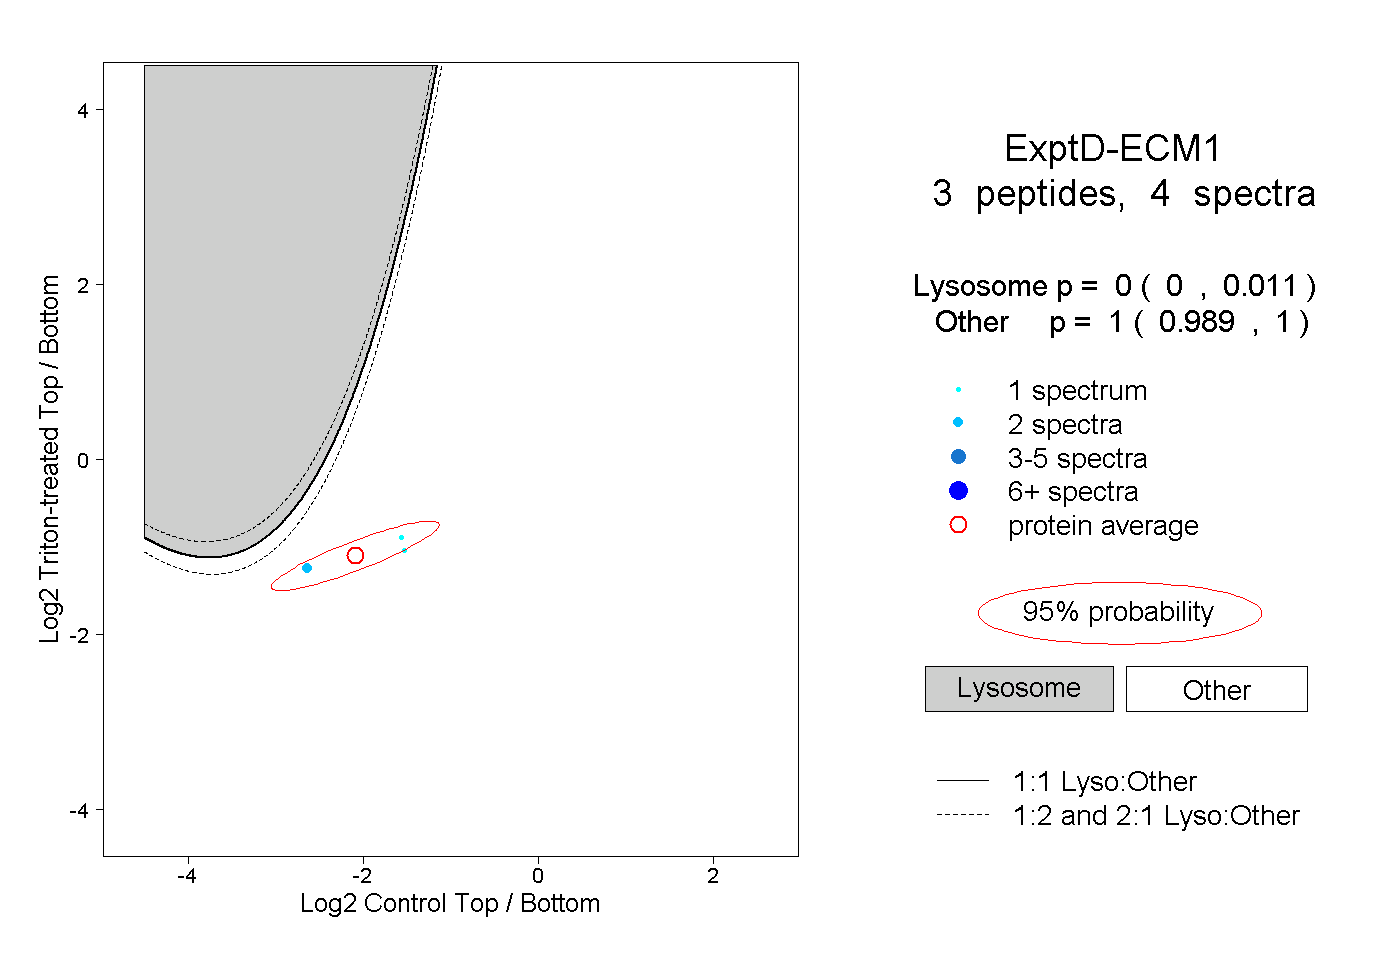
| Expt D |
3
peptides |
4
spectra |
 |
|
0.000
0.000 | 0.011 |
|
|
|
|
|
|
|
1.000
0.989 | 1.000 |