 31
31peptides
spectra
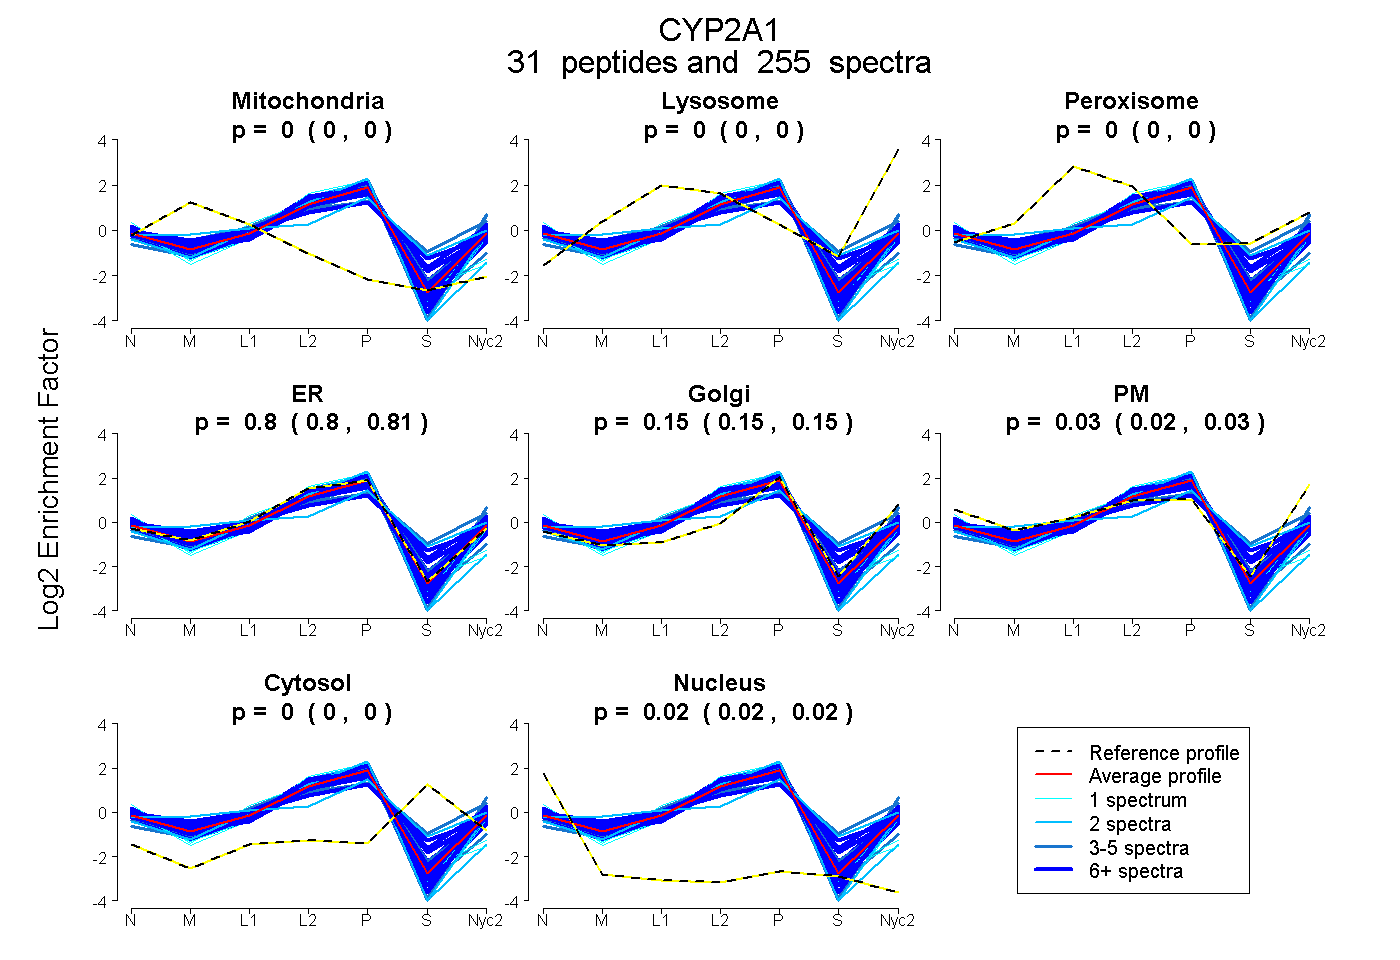
0.000 | 0.000
0.000 | 0.000
0.000 | 0.000
0.798 | 0.805
0.145 | 0.151
0.024 | 0.030
0.000 | 0.000
0.021 | 0.023
25peptides
spectra
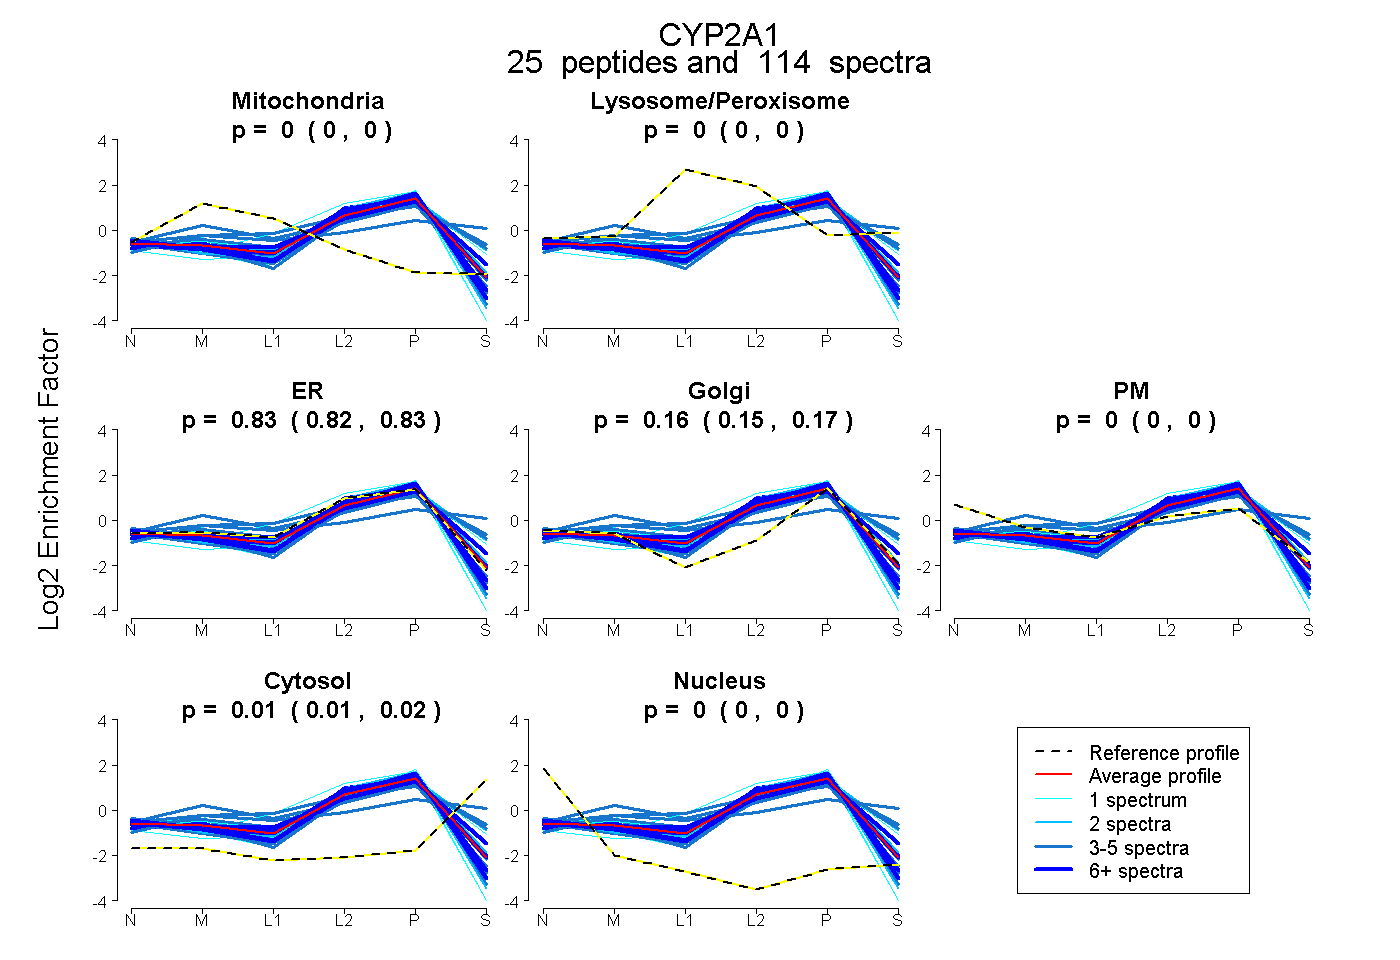
0.000 | 0.000
0.000 | 0.000
0.823 | 0.833
0.151 | 0.166
0.000 | 0.000
0.007 | 0.016
0.000 | 0.000
27peptides
spectra
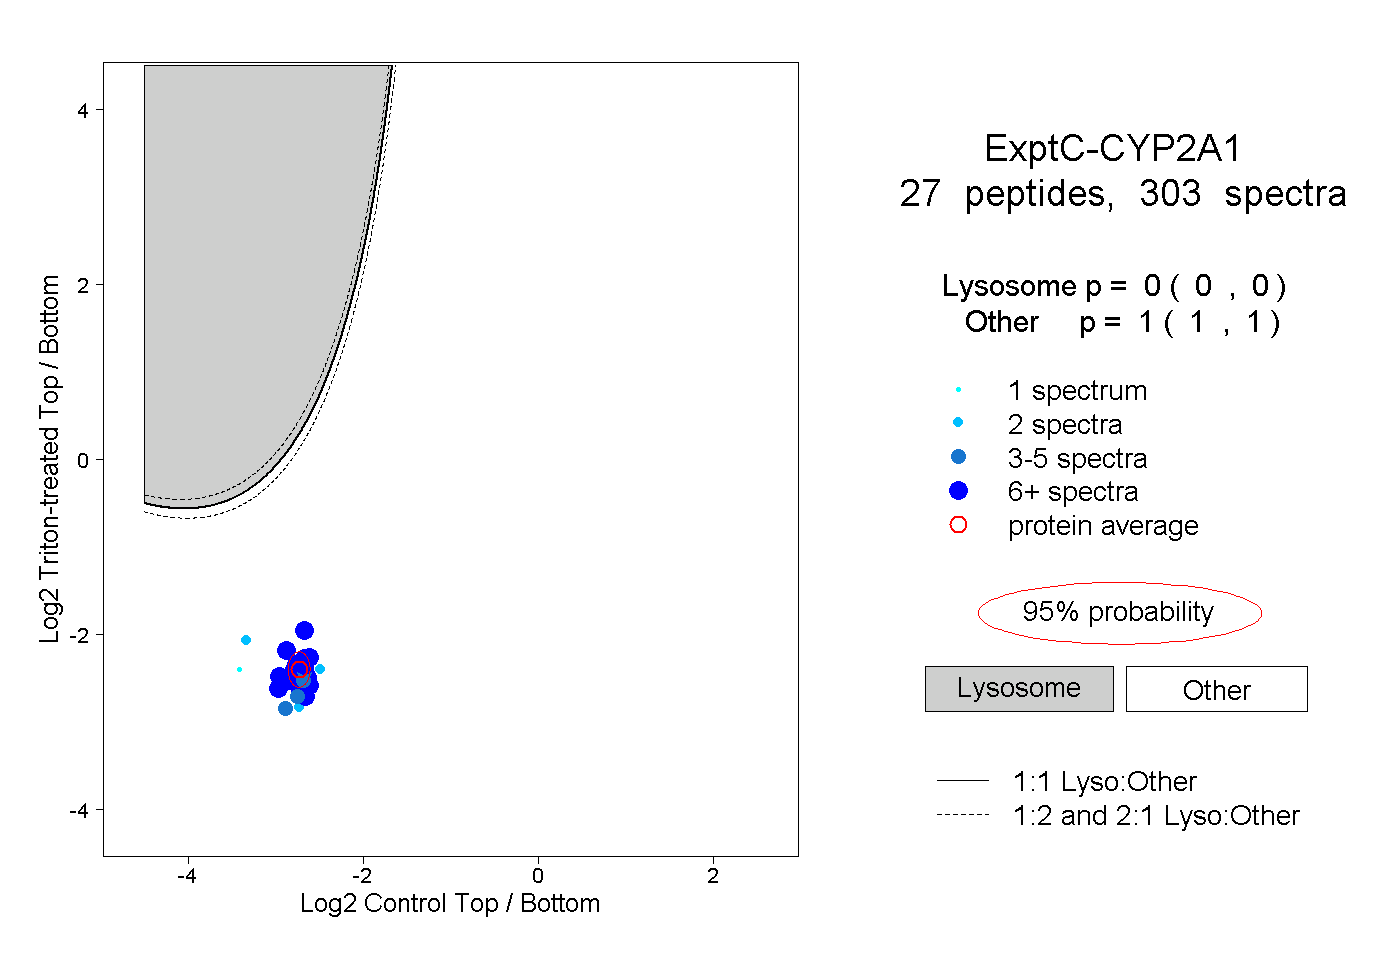
0.000 | 0.000
1.000 | 1.000
13peptides
spectra
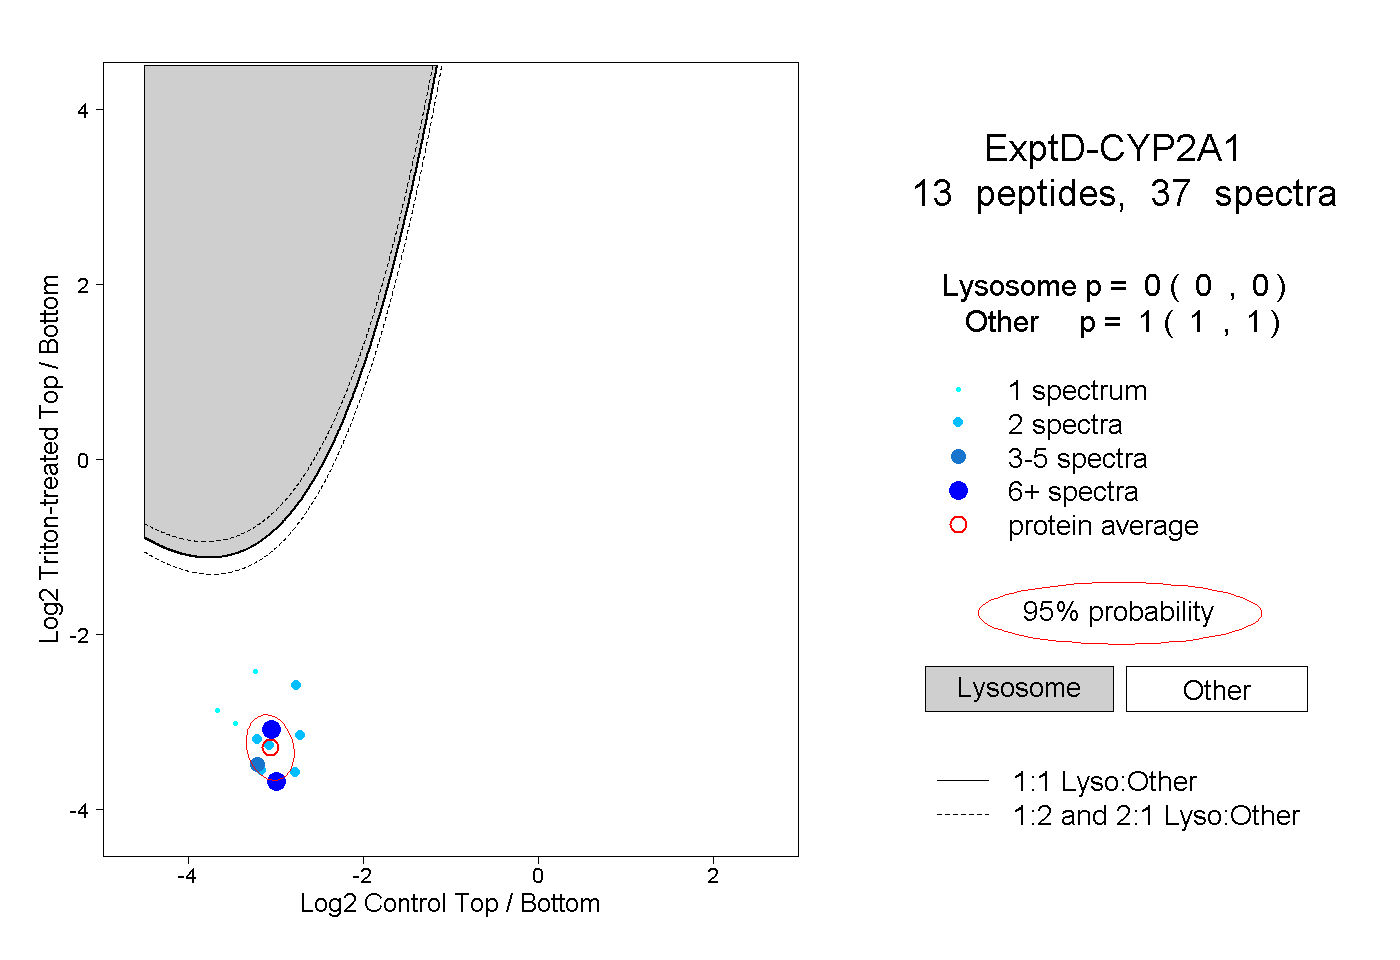
0.000 | 0.000
1.000 | 1.000