 31
31peptides
spectra
0.000 | 0.000
0.000 | 0.000
0.000 | 0.000
0.798 | 0.805
0.145 | 0.151
0.024 | 0.030
0.000 | 0.000
0.021 | 0.023
| Plot | Mito | Lyso | Perox | ER | Golgi | PM | Cytosol | Nucleus | |||||
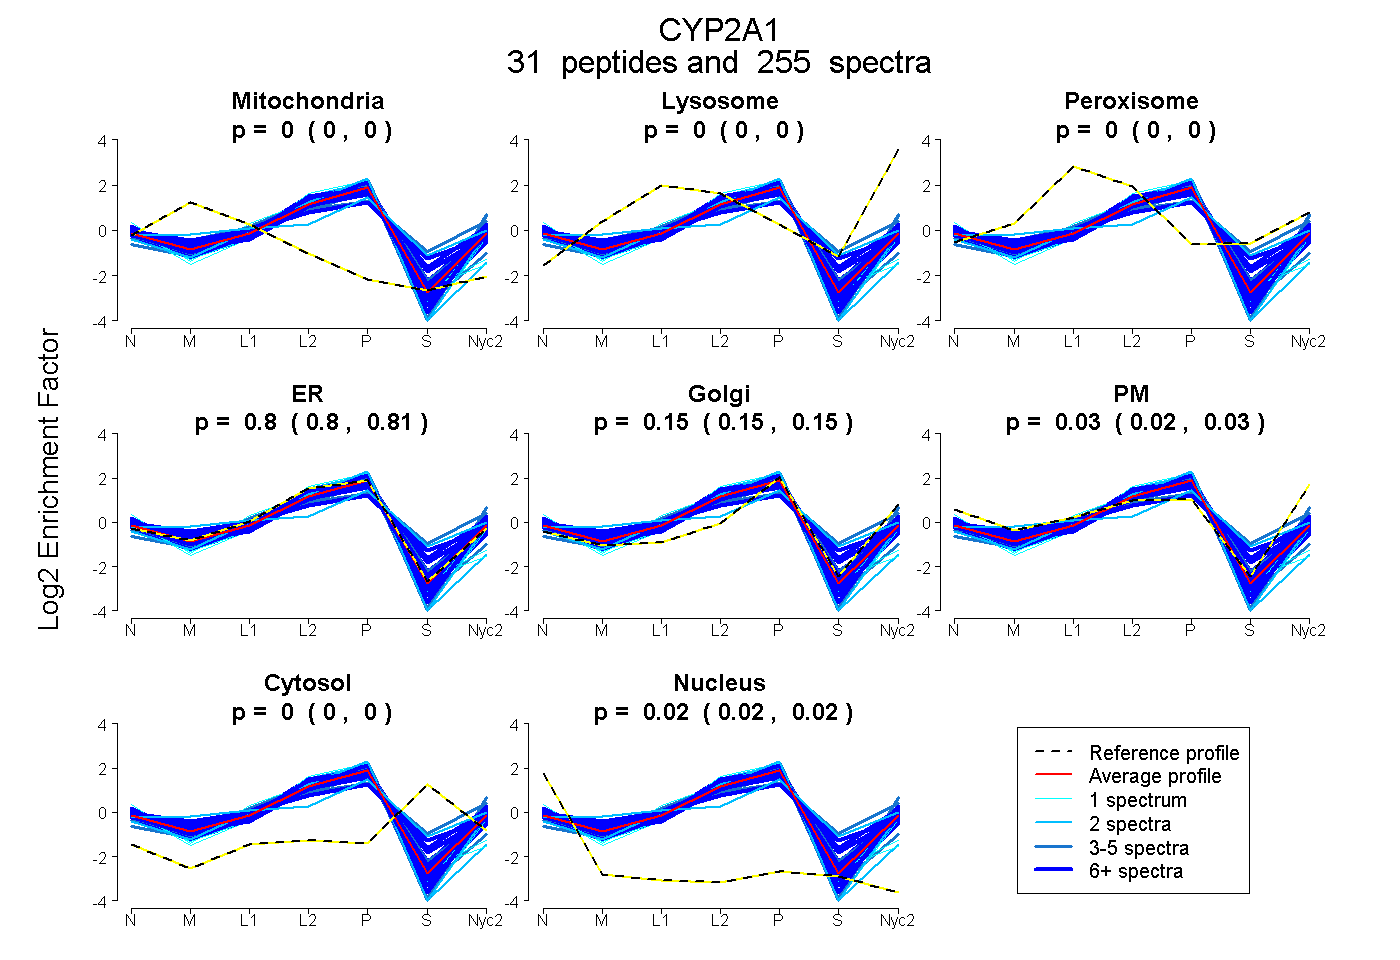
| Expt A |
31 peptides |
255 spectra |
|
0.000 0.000 | 0.000 |
0.000 0.000 | 0.000 |
0.000 0.000 | 0.000 |
0.802 0.798 | 0.805 |
0.149 0.145 | 0.151 |
0.028 0.024 | 0.030 |
0.000 0.000 | 0.000 |
0.022 0.021 | 0.023 |
| 6 spectra, YLPGPQQQIIK | 0.001 | 0.000 | 0.000 | 0.697 | 0.144 | 0.158 | 0.000 | 0.000 | ||
| 9 spectra, QNHSTLDPNSPR | 0.044 | 0.000 | 0.127 | 0.534 | 0.111 | 0.029 | 0.154 | 0.000 | ||
| 2 spectra, YTMSFMPI | 0.051 | 0.000 | 0.219 | 0.154 | 0.479 | 0.000 | 0.097 | 0.000 | ||
| 3 spectra, FAASPTGQLYDMFHSVMK | 0.000 | 0.000 | 0.000 | 0.952 | 0.000 | 0.000 | 0.000 | 0.048 | ||
| 6 spectra, YGFLLLMK | 0.067 | 0.000 | 0.000 | 0.743 | 0.189 | 0.000 | 0.000 | 0.000 | ||
| 7 spectra, VHEEIEQVIGR | 0.000 | 0.000 | 0.043 | 0.596 | 0.049 | 0.193 | 0.118 | 0.000 | ||
| 5 spectra, MPYTQAVINEIQR | 0.000 | 0.011 | 0.275 | 0.225 | 0.375 | 0.000 | 0.113 | 0.000 | ||
| 1 spectrum, NAAFLPFSTGK | 0.000 | 0.000 | 0.000 | 0.980 | 0.000 | 0.000 | 0.000 | 0.020 | ||
| 2 spectra, VVVLYGYDAVK | 0.000 | 0.000 | 0.000 | 0.888 | 0.112 | 0.000 | 0.000 | 0.000 | ||
| 11 spectra, LSIATLR | 0.000 | 0.000 | 0.000 | 0.765 | 0.156 | 0.000 | 0.063 | 0.015 | ||
| 8 spectra, FCLGDGLAK | 0.000 | 0.000 | 0.000 | 0.936 | 0.023 | 0.000 | 0.000 | 0.040 | ||
| 12 spectra, QPQYEDHMK | 0.000 | 0.000 | 0.000 | 0.747 | 0.201 | 0.000 | 0.026 | 0.026 | ||
| 1 spectrum, LPPGPTPLPFIGNYLQLNTK | 0.000 | 0.000 | 0.000 | 0.823 | 0.000 | 0.146 | 0.000 | 0.031 | ||
| 17 spectra, YGPVFTIHLGPR | 0.000 | 0.000 | 0.000 | 0.729 | 0.061 | 0.210 | 0.000 | 0.000 | ||
| 8 spectra, HPDVEAK | 0.000 | 0.000 | 0.000 | 0.713 | 0.056 | 0.184 | 0.036 | 0.011 | ||
| 3 spectra, GEQATYNTLFK | 0.038 | 0.000 | 0.032 | 0.689 | 0.215 | 0.001 | 0.000 | 0.026 | ||
| 3 spectra, DFIDSFLIR | 0.000 | 0.000 | 0.000 | 0.858 | 0.099 | 0.000 | 0.000 | 0.043 | ||
| 26 spectra, NFIDSFLIR | 0.000 | 0.000 | 0.000 | 0.809 | 0.191 | 0.000 | 0.000 | 0.000 | ||
| 4 spectra, GYGVAFSSGER | 0.000 | 0.000 | 0.000 | 0.658 | 0.149 | 0.193 | 0.000 | 0.000 | ||
| 3 spectra, MLQGTCGAPIDPTIYLSK | 0.000 | 0.000 | 0.000 | 0.833 | 0.104 | 0.000 | 0.063 | 0.000 | ||
| 23 spectra, FSNLAPLGIPR | 0.000 | 0.000 | 0.000 | 0.852 | 0.037 | 0.111 | 0.000 | 0.000 | ||
| 27 spectra, LEDFMIEK | 0.022 | 0.000 | 0.000 | 0.732 | 0.237 | 0.007 | 0.000 | 0.002 | ||
| 29 spectra, EALVDQAEEFSGR | 0.000 | 0.000 | 0.000 | 0.881 | 0.089 | 0.000 | 0.000 | 0.030 | ||
| 10 spectra, DVYSSITQLSER | 0.025 | 0.000 | 0.000 | 0.752 | 0.149 | 0.056 | 0.000 | 0.018 | ||
| 1 spectrum, GTDVFPILGSLMTDPK | 0.000 | 0.000 | 0.000 | 0.913 | 0.000 | 0.000 | 0.000 | 0.087 | ||
| 9 spectra, ILEEAGYLIK | 0.000 | 0.000 | 0.000 | 0.782 | 0.041 | 0.054 | 0.123 | 0.000 | ||
| 7 spectra, TVSNVISSIVFGER | 0.027 | 0.000 | 0.008 | 0.732 | 0.140 | 0.086 | 0.007 | 0.000 | ||
| 2 spectra, DFDPQNFLDDK | 0.000 | 0.000 | 0.000 | 0.931 | 0.000 | 0.000 | 0.000 | 0.069 | ||
| 5 spectra, GFFLPK | 0.000 | 0.000 | 0.000 | 0.608 | 0.133 | 0.258 | 0.000 | 0.000 | ||
| 4 spectra, FFPSPK | 0.000 | 0.000 | 0.000 | 0.800 | 0.189 | 0.000 | 0.000 | 0.011 | ||
| 1 spectrum, LEDINESPKPLGFTR | 0.000 | 0.000 | 0.000 | 0.899 | 0.000 | 0.000 | 0.000 | 0.101 |
| Plot | Mito | Lyso or Perox | ER | Golgi | PM | Cytosol | Nucleus | ||||||
| Expt B |
25 peptides |
114 spectra |
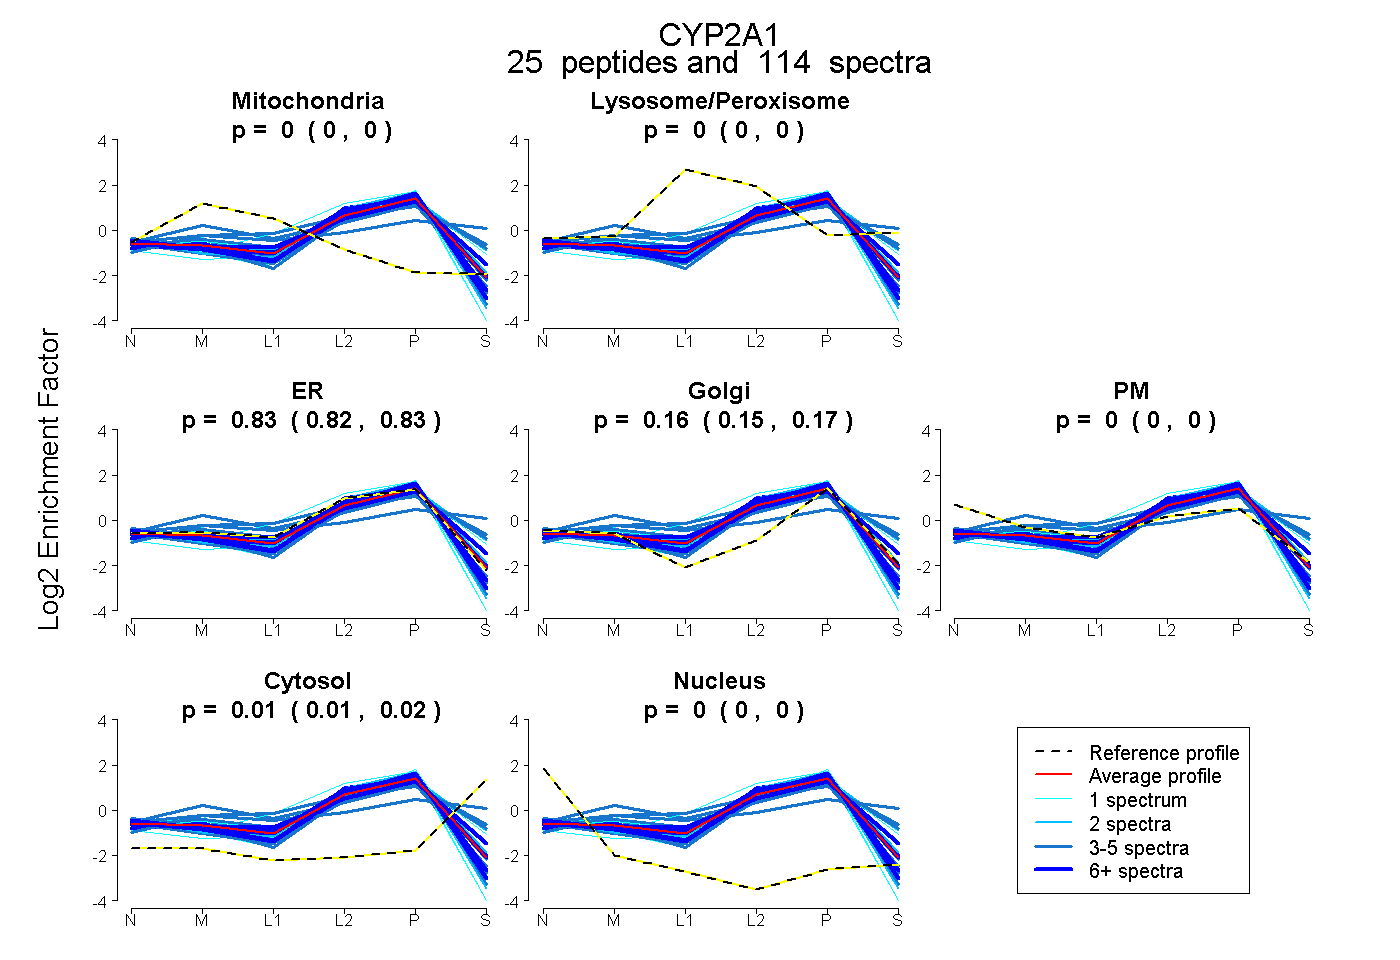 |
0.000 0.000 | 0.000 |
0.000 0.000 | 0.000 |
0.828 0.823 | 0.833 |
0.160 0.151 | 0.166 |
0.000 0.000 | 0.000 |
0.012 0.007 | 0.016 |
0.000 0.000 | 0.000 |
|||
| Plot | Lyso | Other | |||||||||||
| Expt C |
27 peptides |
303 spectra |
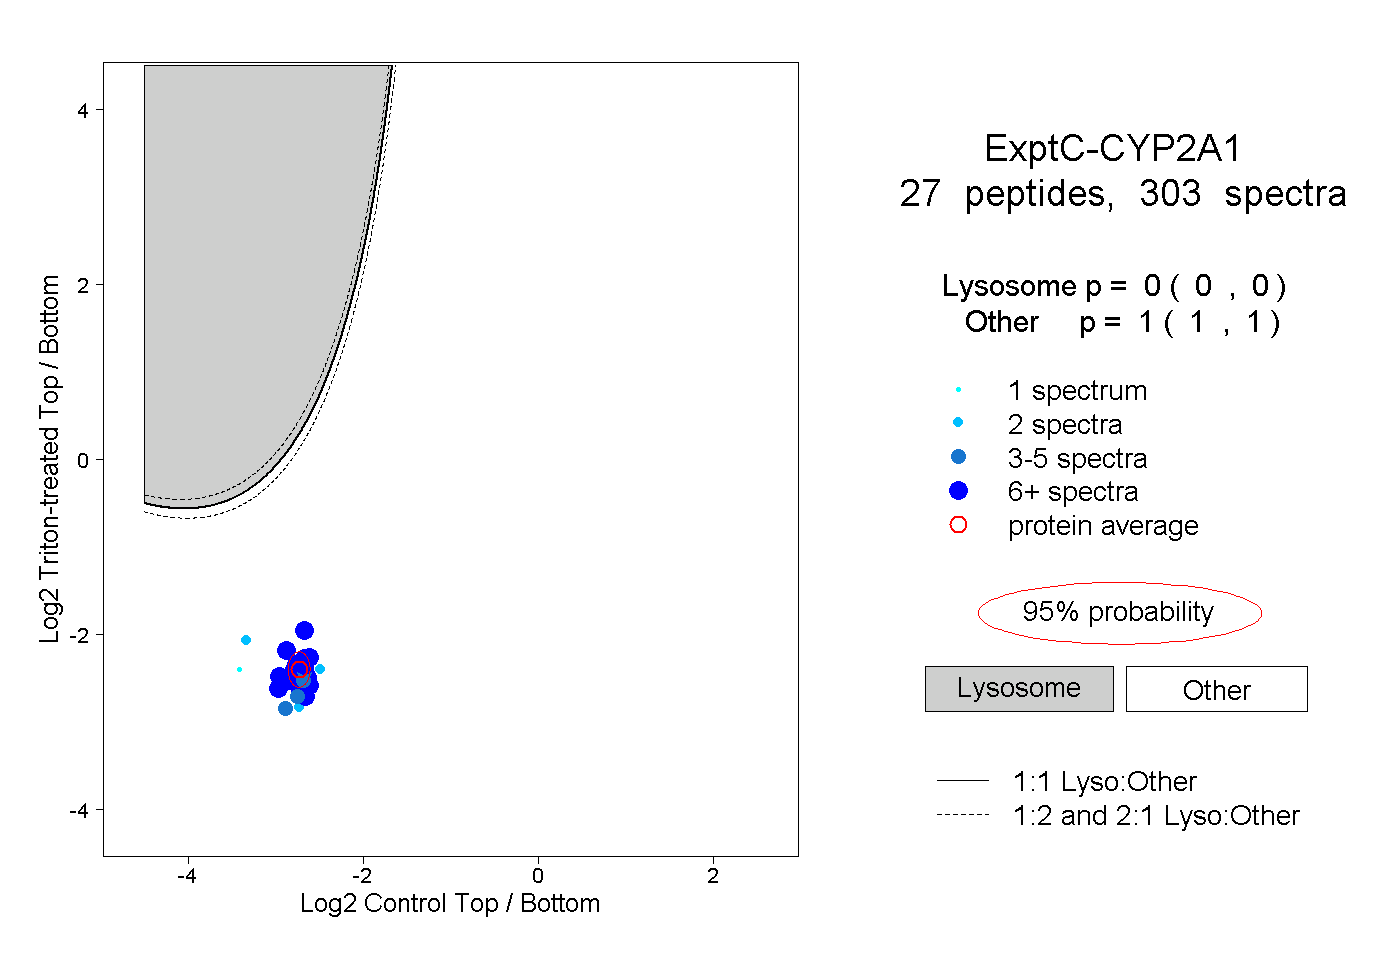 |
0.000 0.000 | 0.000 |
1.000 1.000 | 1.000 |
||||||||
| Plot | Lyso | Other | |||||||||||
| Expt D |
13 peptides |
37 spectra |
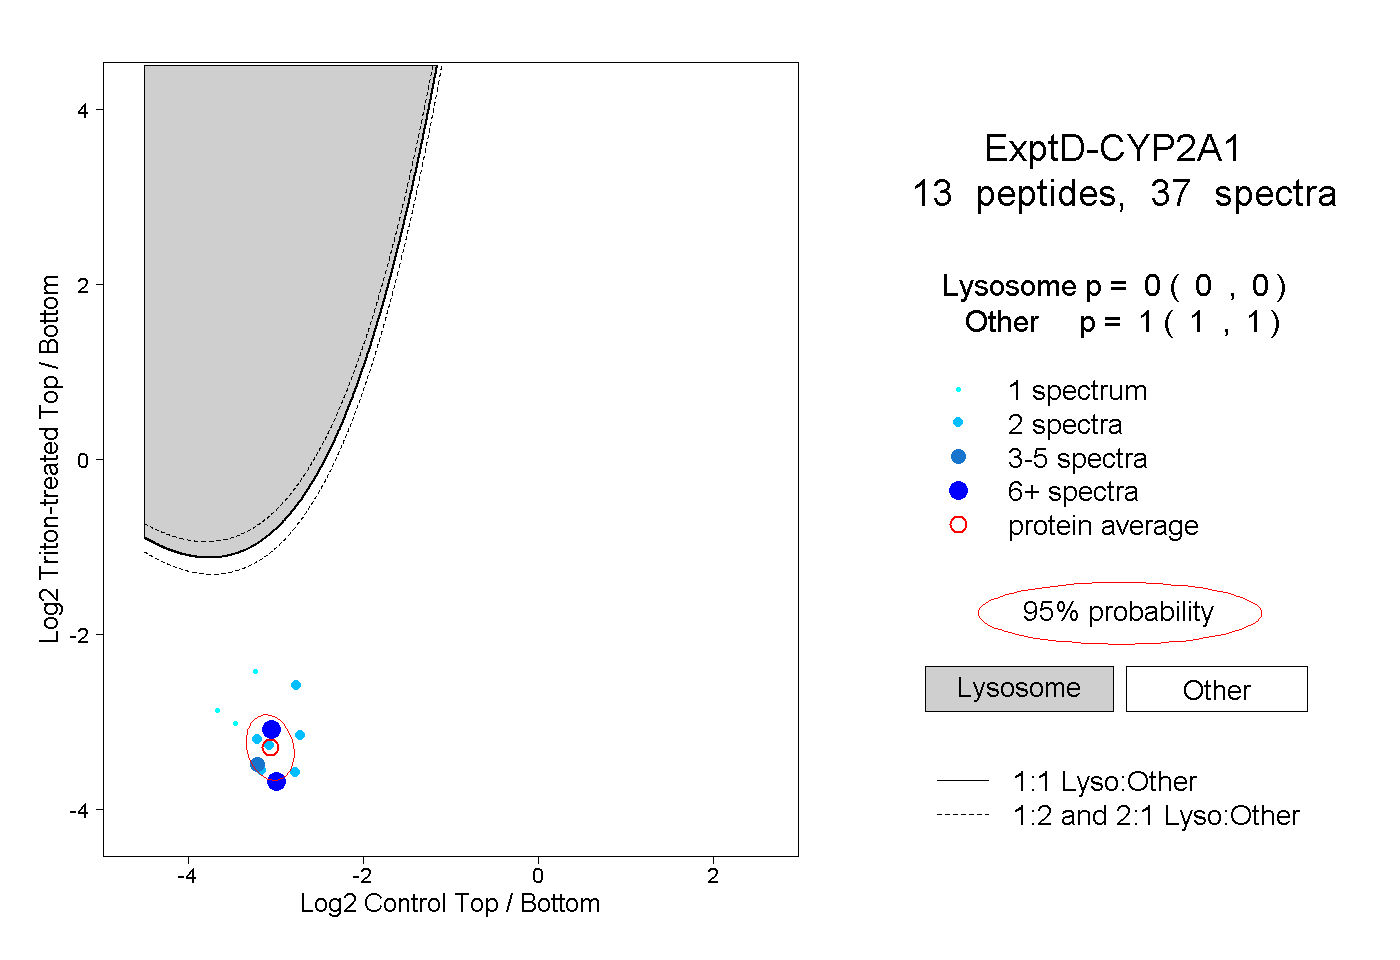 |
0.000 0.000 | 0.000 |
1.000 1.000 | 1.000 |