 4
4peptides
spectra
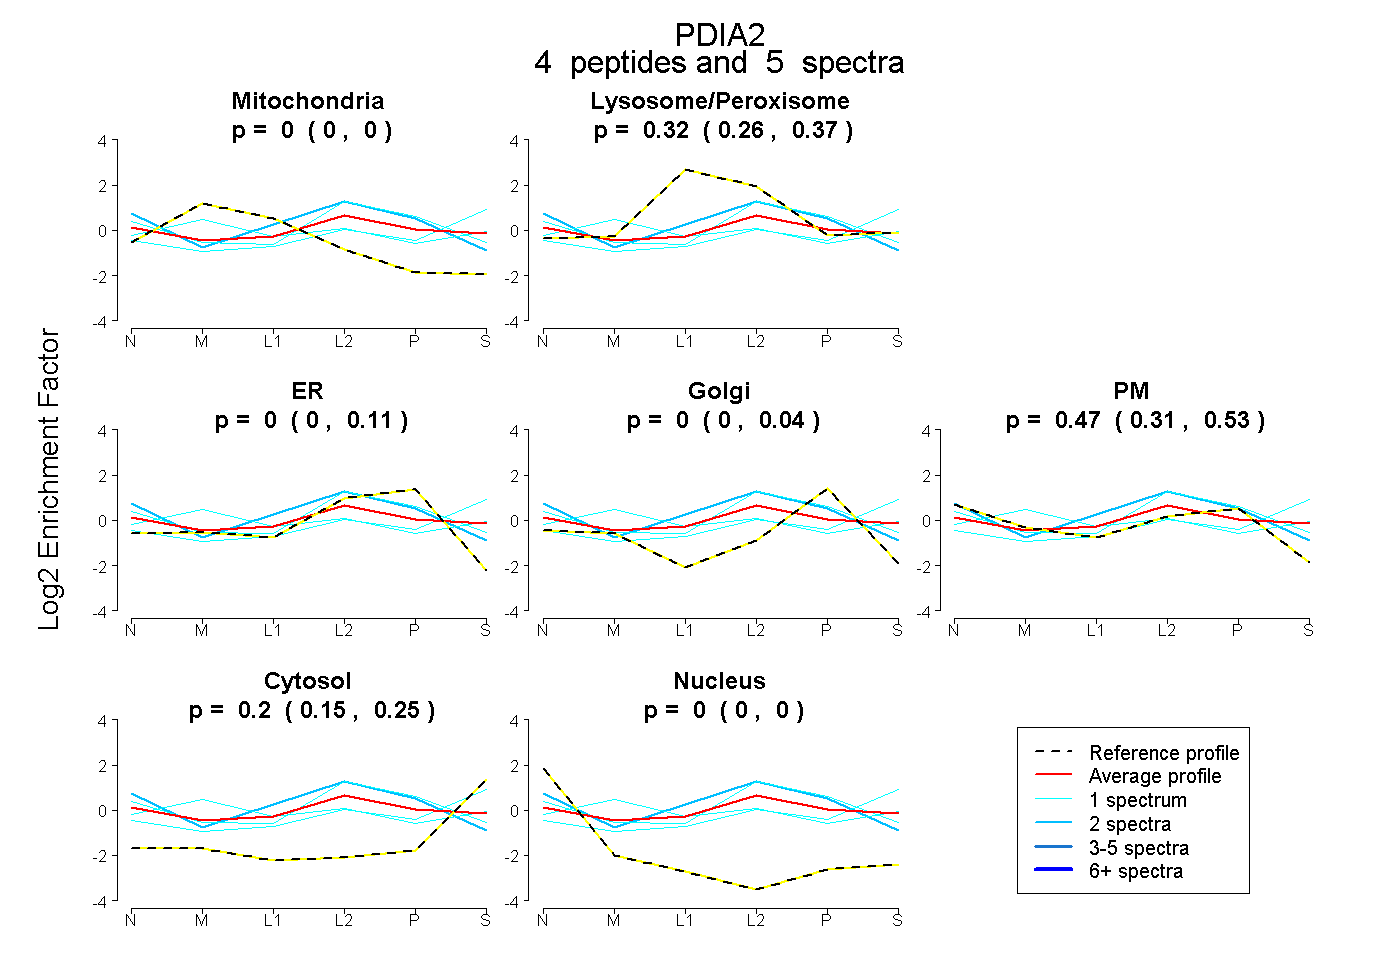
0.000 | 0.000
0.263 | 0.373
0.000 | 0.107
0.000 | 0.036
0.314 | 0.530
0.148 | 0.245
0.000 | 0.000
11peptides
spectra
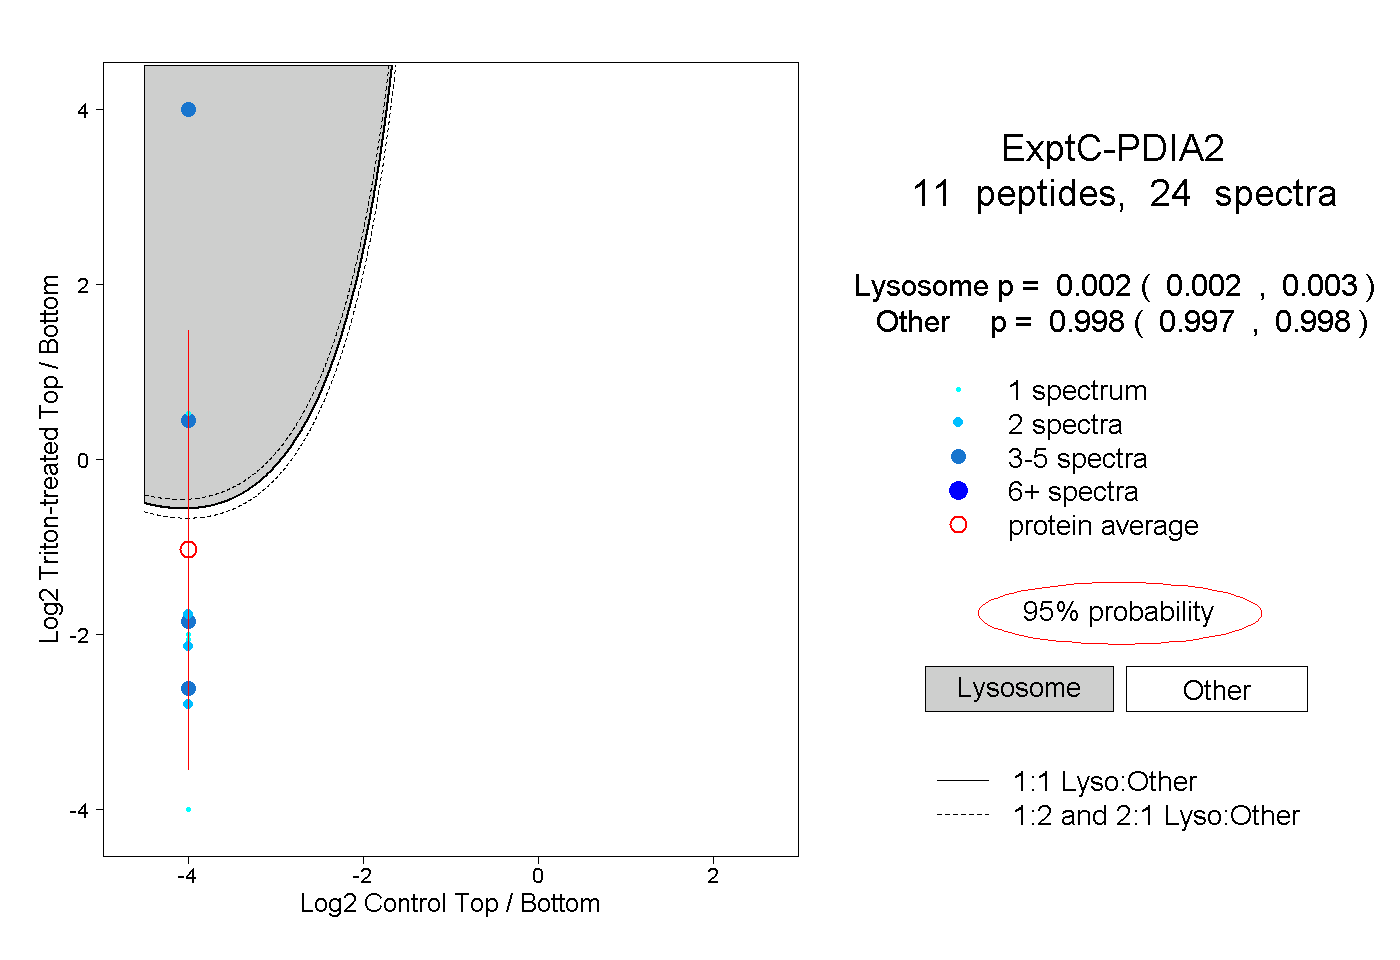
0.002 | 0.003
0.997 | 0.998
4peptides
spectra
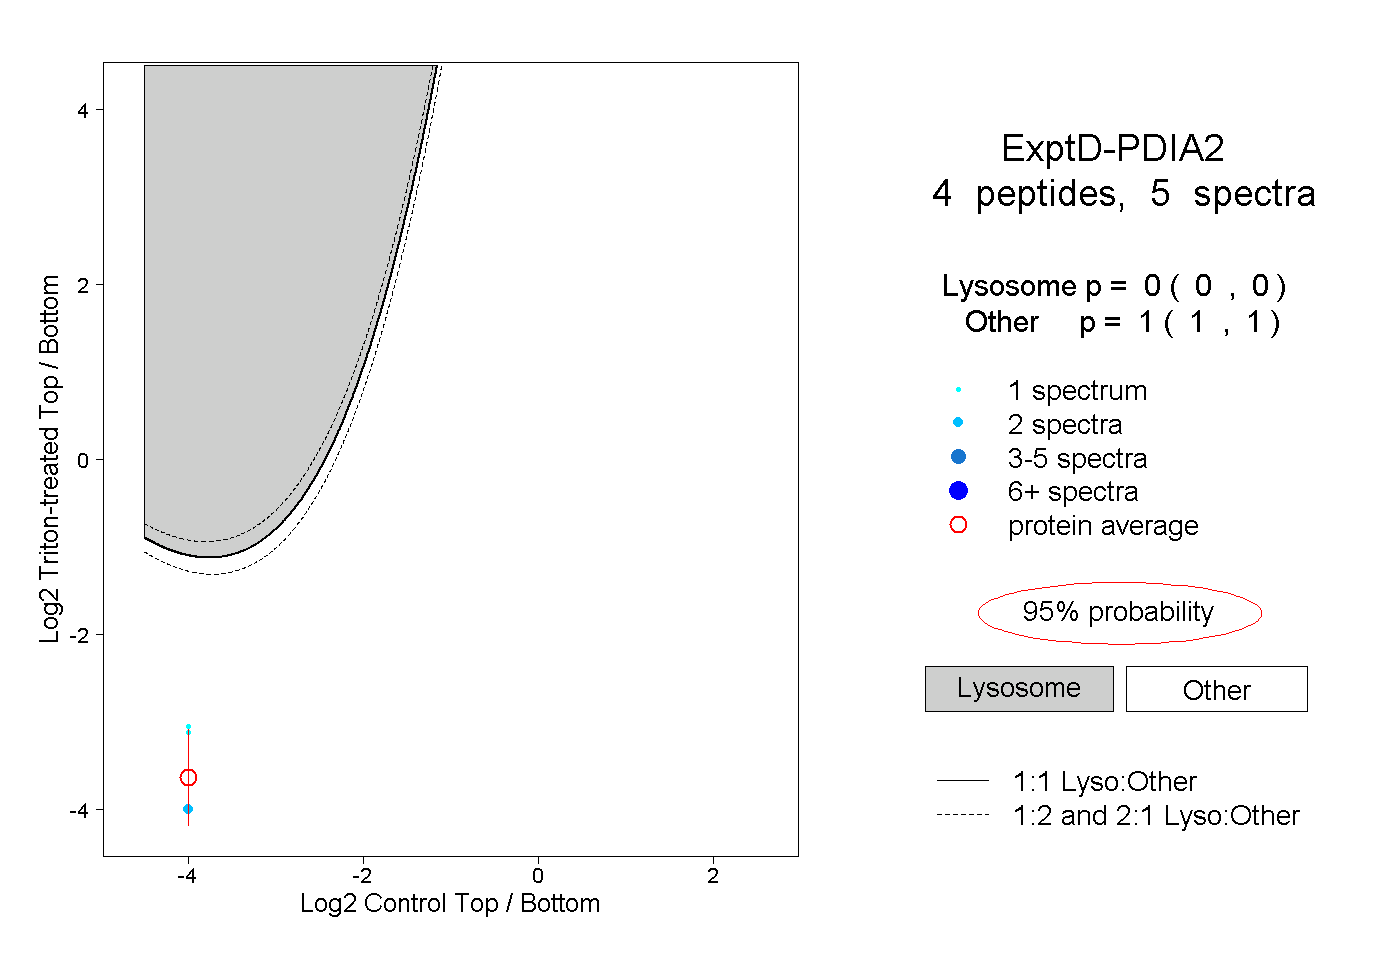
0.000 | 0.000
1.000 | 1.000