 4
4peptides
spectra
0.000 | 0.000
0.263 | 0.373
0.000 | 0.107
0.000 | 0.036
0.314 | 0.530
0.148 | 0.245
0.000 | 0.000
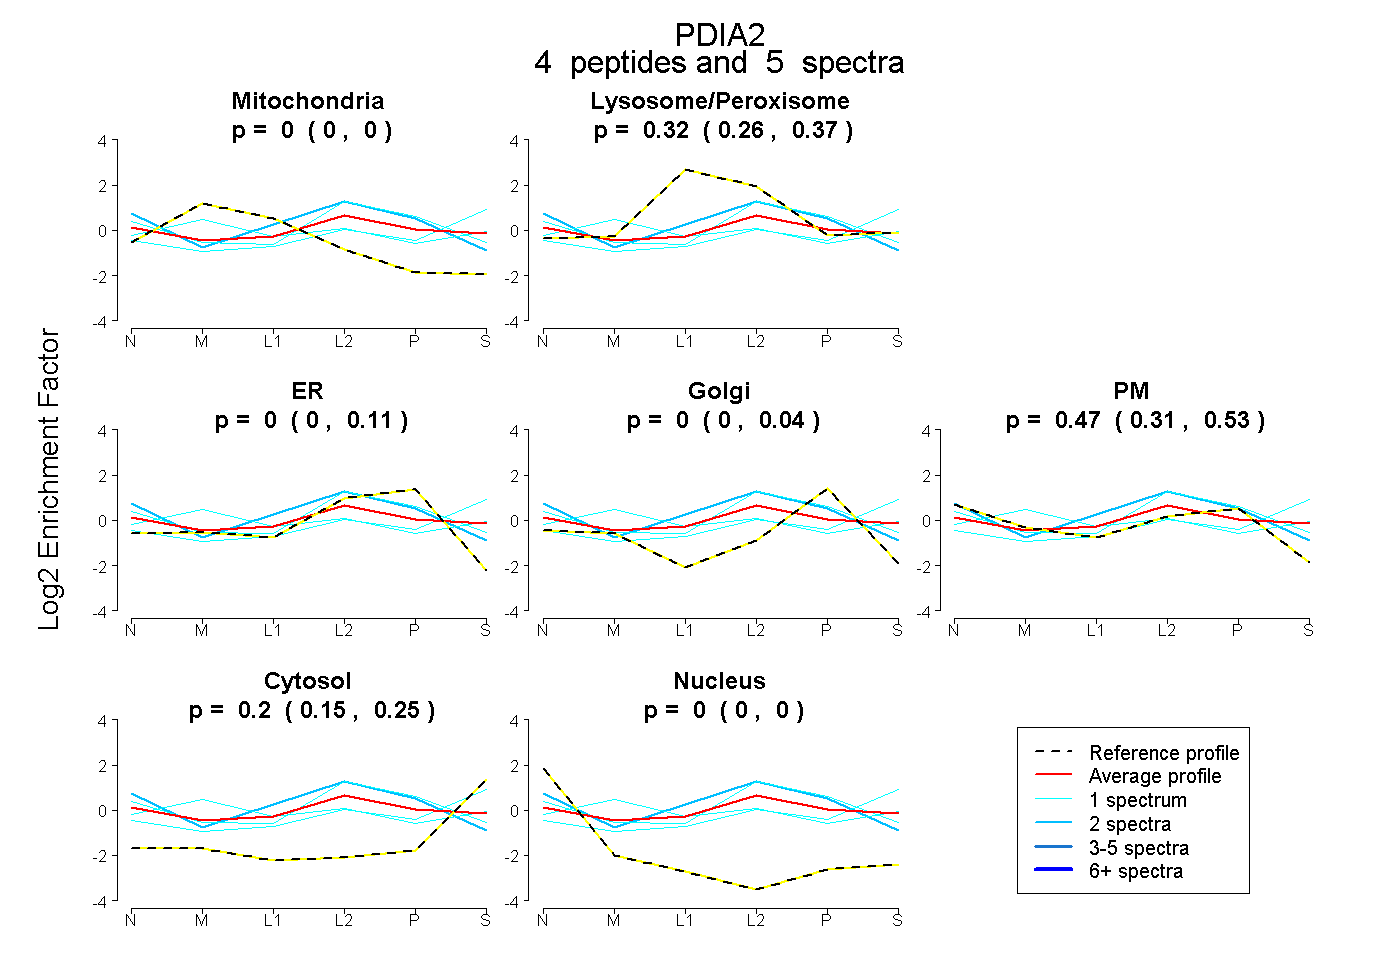
| Plot | Mito | Lyso or Perox | ER | Golgi | PM | Cytosol | Nucleus | ||||||
| Expt B |
4 peptides |
5 spectra |
|
0.000 0.000 | 0.000 |
0.323 0.263 | 0.373 |
0.000 0.000 | 0.107 |
0.000 0.000 | 0.036 |
0.474 0.314 | 0.530 |
0.202 0.148 | 0.245 |
0.000 0.000 | 0.000 |
| 1 spectrum, NFEQVAFDETK | 0.200 | 0.265 | 0.000 | 0.000 | 0.290 | 0.245 | 0.000 | |||
| 1 spectrum, TNPEEYIGPK | 0.000 | 0.317 | 0.000 | 0.000 | 0.199 | 0.484 | 0.000 | |||
| 1 spectrum, EAAPPFR | 0.000 | 0.238 | 0.226 | 0.000 | 0.452 | 0.083 | 0.000 | |||
| 2 spectra, DTVVLFK | 0.000 | 0.364 | 0.006 | 0.000 | 0.631 | 0.000 | 0.000 |
| Plot | Lyso | Other | |||||||||||
| Expt C |
11 peptides |
24 spectra |
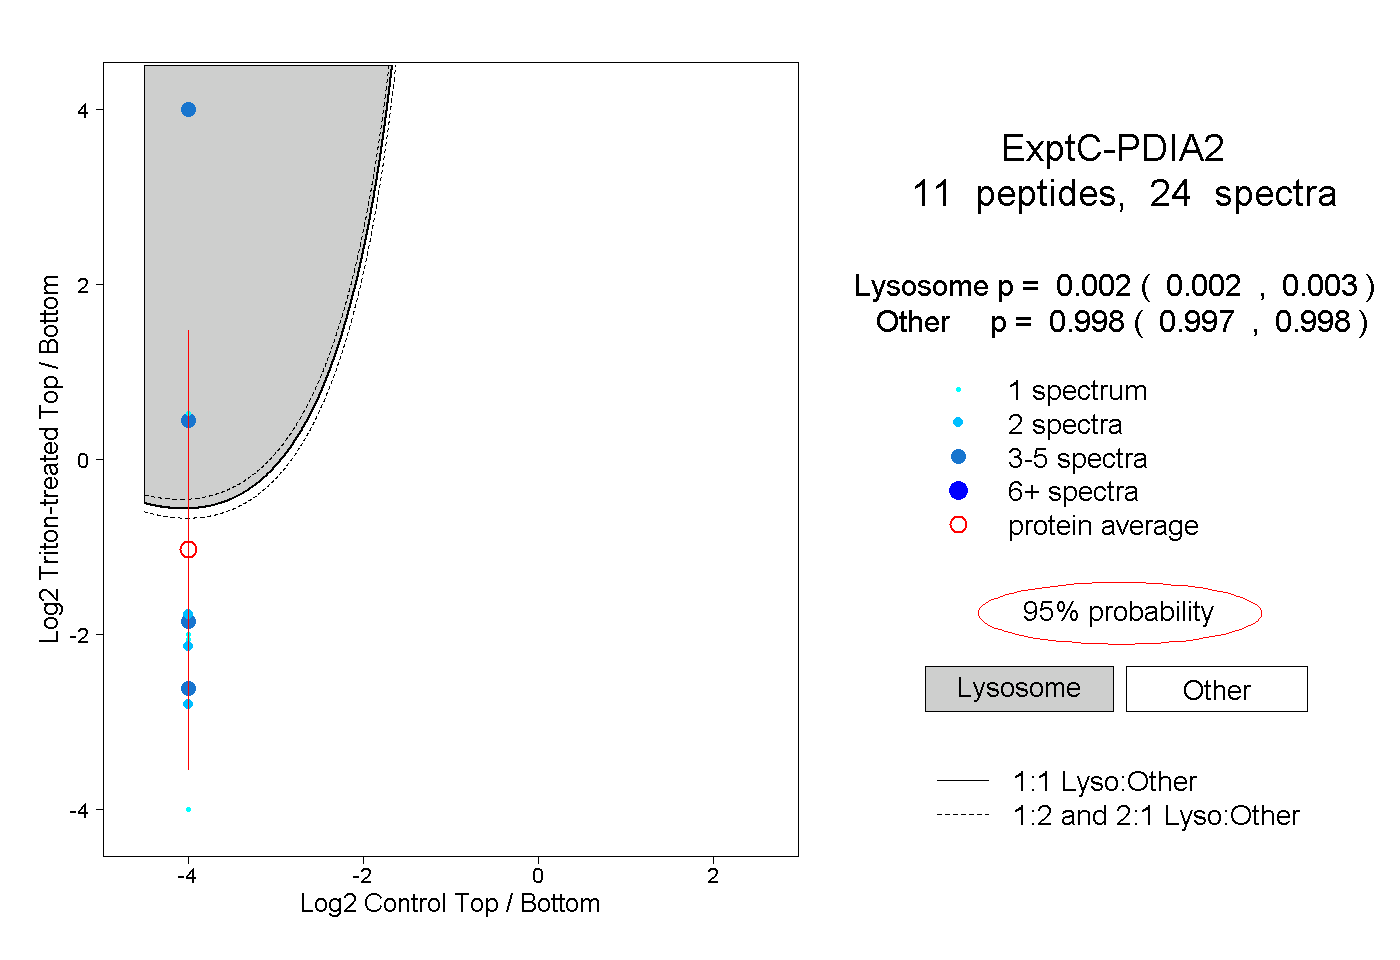 |
0.002 0.002 | 0.003 |
0.998 0.997 | 0.998 |
||||||||
| Plot | Lyso | Other | |||||||||||
| Expt D |
4 peptides |
5 spectra |
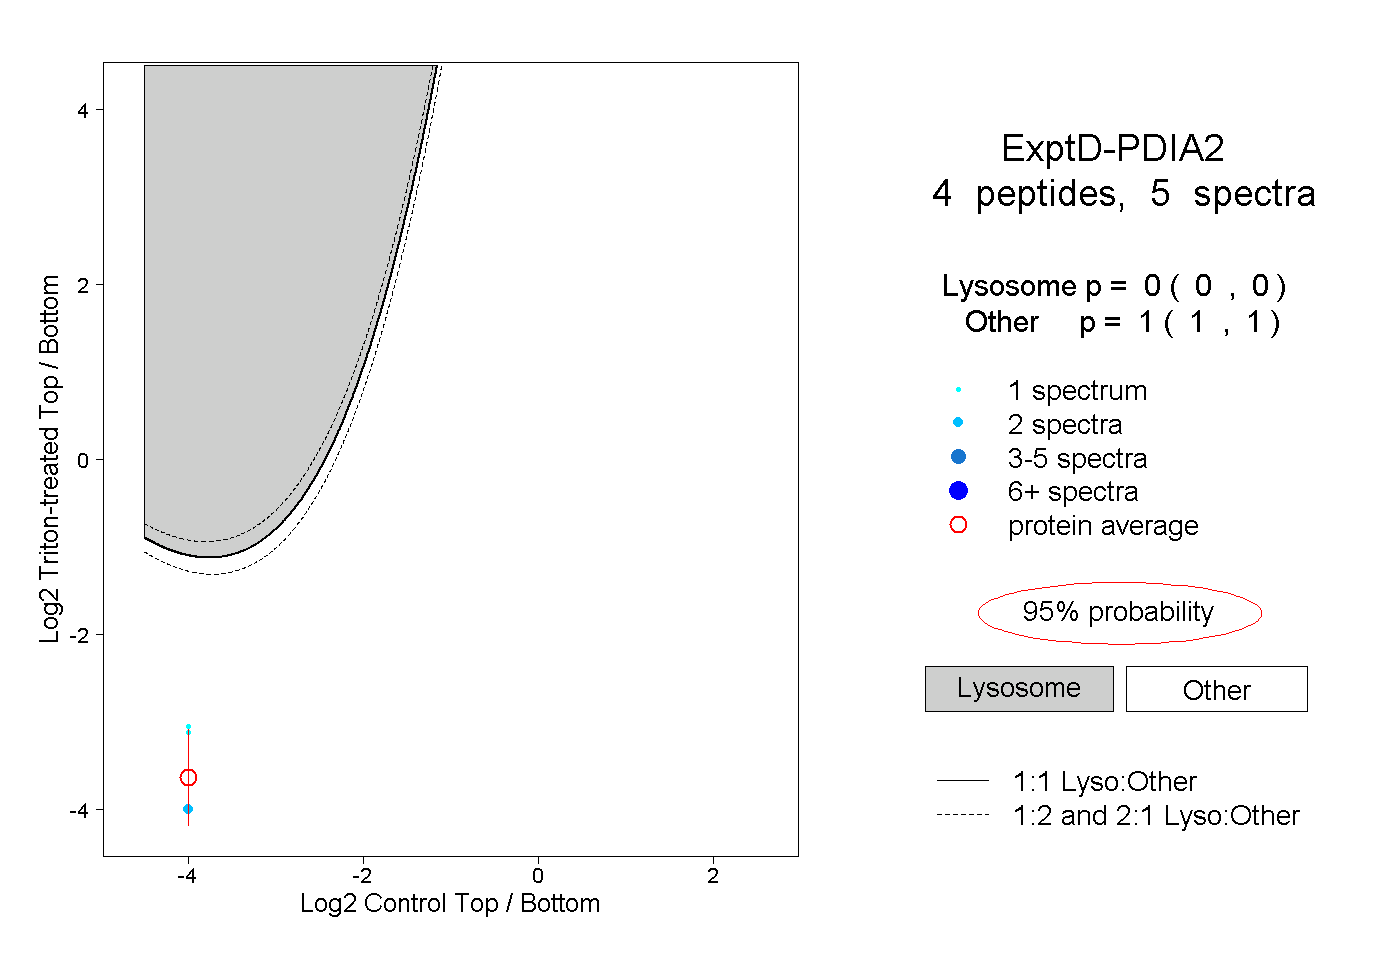 |
0.000 0.000 | 0.000 |
1.000 1.000 | 1.000 |