 4
4peptides
spectra
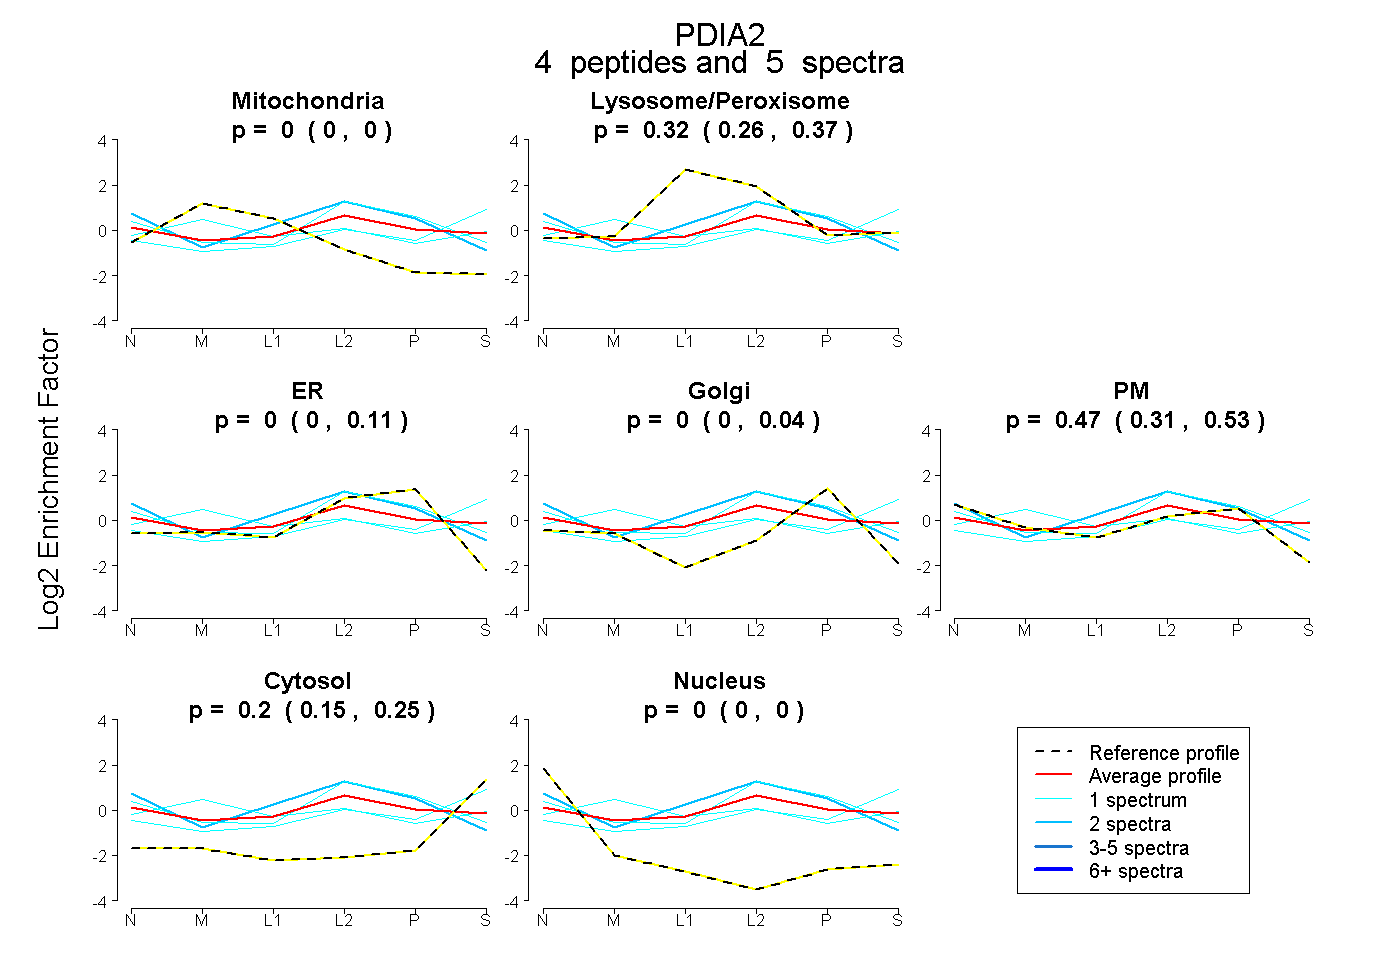
0.000 | 0.000
0.263 | 0.373
0.000 | 0.107
0.000 | 0.036
0.314 | 0.530
0.148 | 0.245
0.000 | 0.000
11peptides
spectra
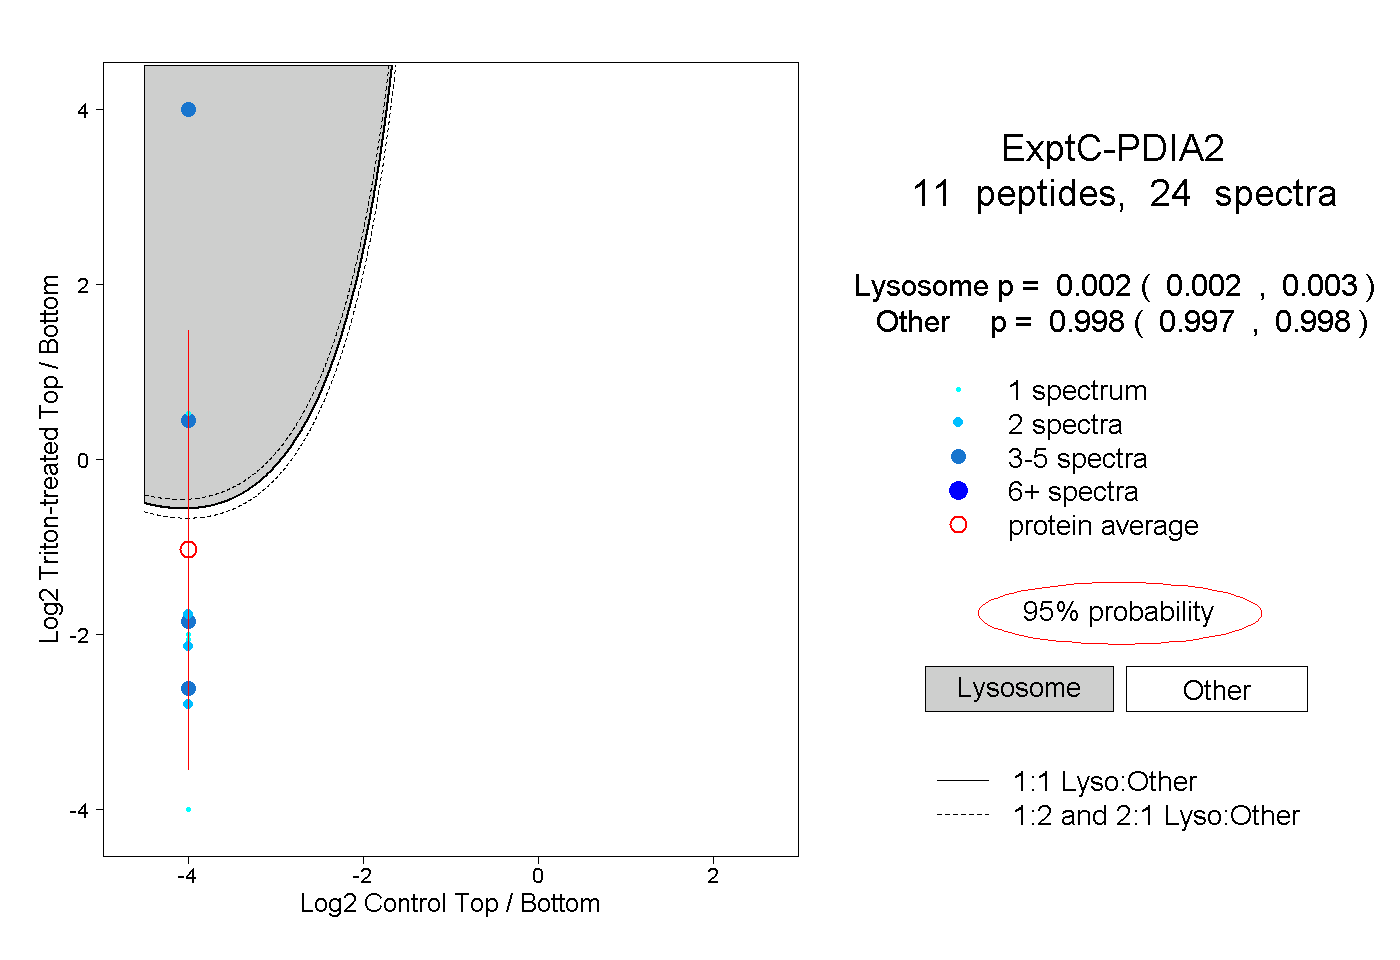
0.002 | 0.003
0.997 | 0.998
| Plot | Mito | Lyso or Perox | ER | Golgi | PM | Cytosol | Nucleus | ||||||
| Expt B |
4 peptides |
5 spectra |
|
0.000 0.000 | 0.000 |
0.323 0.263 | 0.373 |
0.000 0.000 | 0.107 |
0.000 0.000 | 0.036 |
0.474 0.314 | 0.530 |
0.202 0.148 | 0.245 |
0.000 0.000 | 0.000 |
|||
| Plot | Lyso | Other | |||||||||||
| Expt C |
11 peptides |
24 spectra |
|
0.002 0.002 | 0.003 |
0.998 0.997 | 0.998 |
| 2 spectra, LINVETTK | 0.000 | 1.000 | ||||||||
| 5 spectra, DLETFSK | 0.000 | 1.000 | ||||||||
| 1 spectrum, LEDEEGVQALMAK | 0.000 | 1.000 | ||||||||
| 2 spectra, ALAPEYSK | 0.000 | 1.000 | ||||||||
| 3 spectra, AEEAPTLR | 1.000 | 0.000 | ||||||||
| 3 spectra, VDGPAEPELTK | 1.000 | 0.000 | ||||||||
| 1 spectrum, ELLTGFR | 0.000 | 1.000 | ||||||||
| 1 spectrum, NFEQVAFDETK | 1.000 | 0.000 | ||||||||
| 1 spectrum, EAGLDLGDLSR | 0.000 | 1.000 | ||||||||
| 3 spectra, FFPAGPDR | 0.000 | 1.000 | ||||||||
| 2 spectra, EAAPPFR | 0.000 | 1.000 |
| Plot | Lyso | Other | |||||||||||
| Expt D |
4 peptides |
5 spectra |
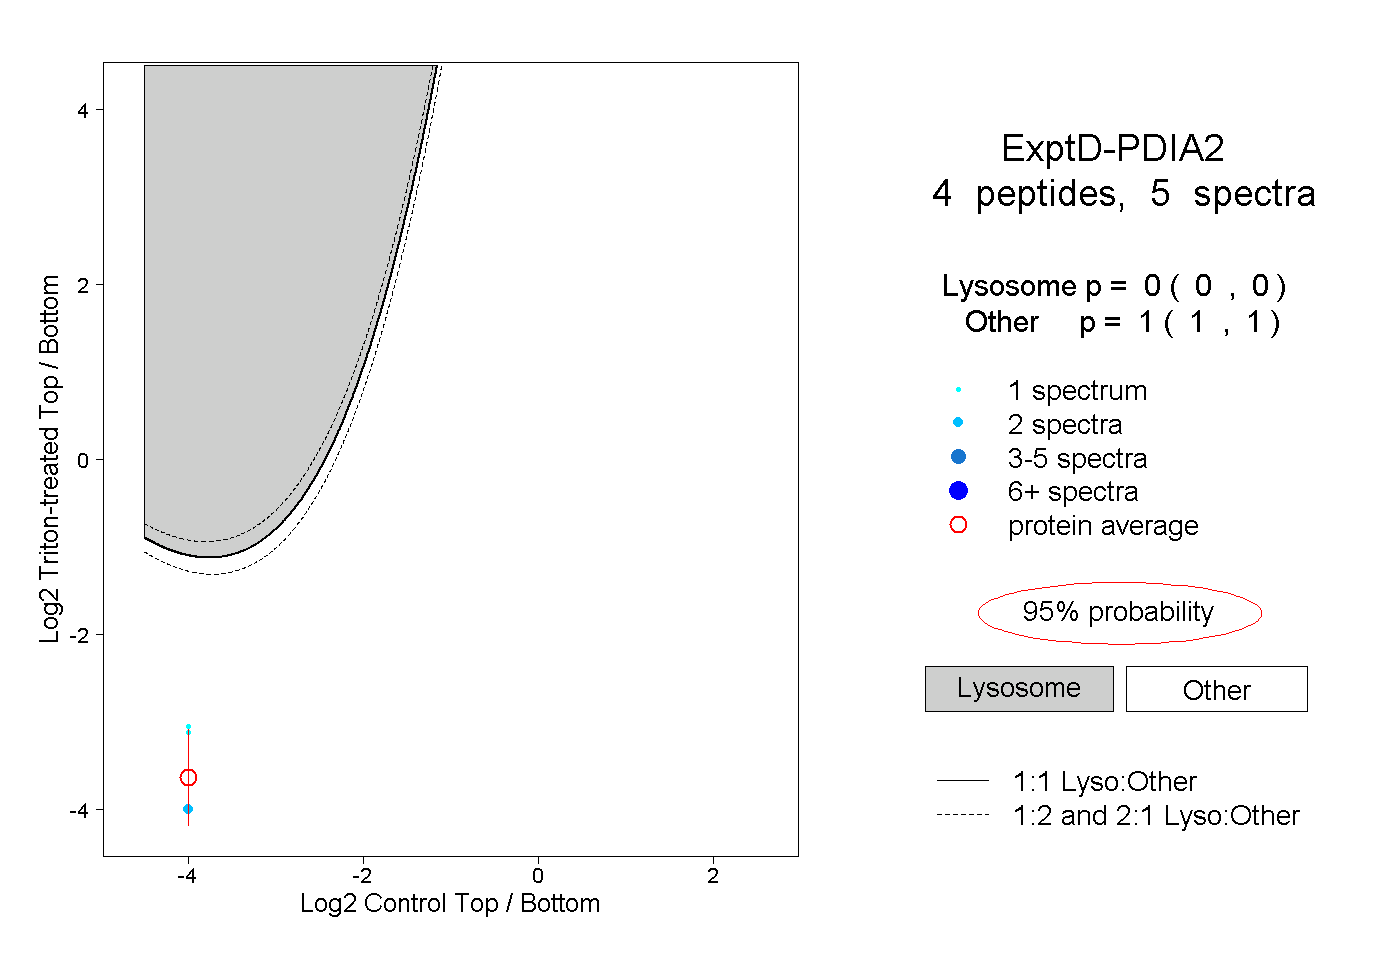 |
0.000 0.000 | 0.000 |
1.000 1.000 | 1.000 |