 8
8peptides
spectra
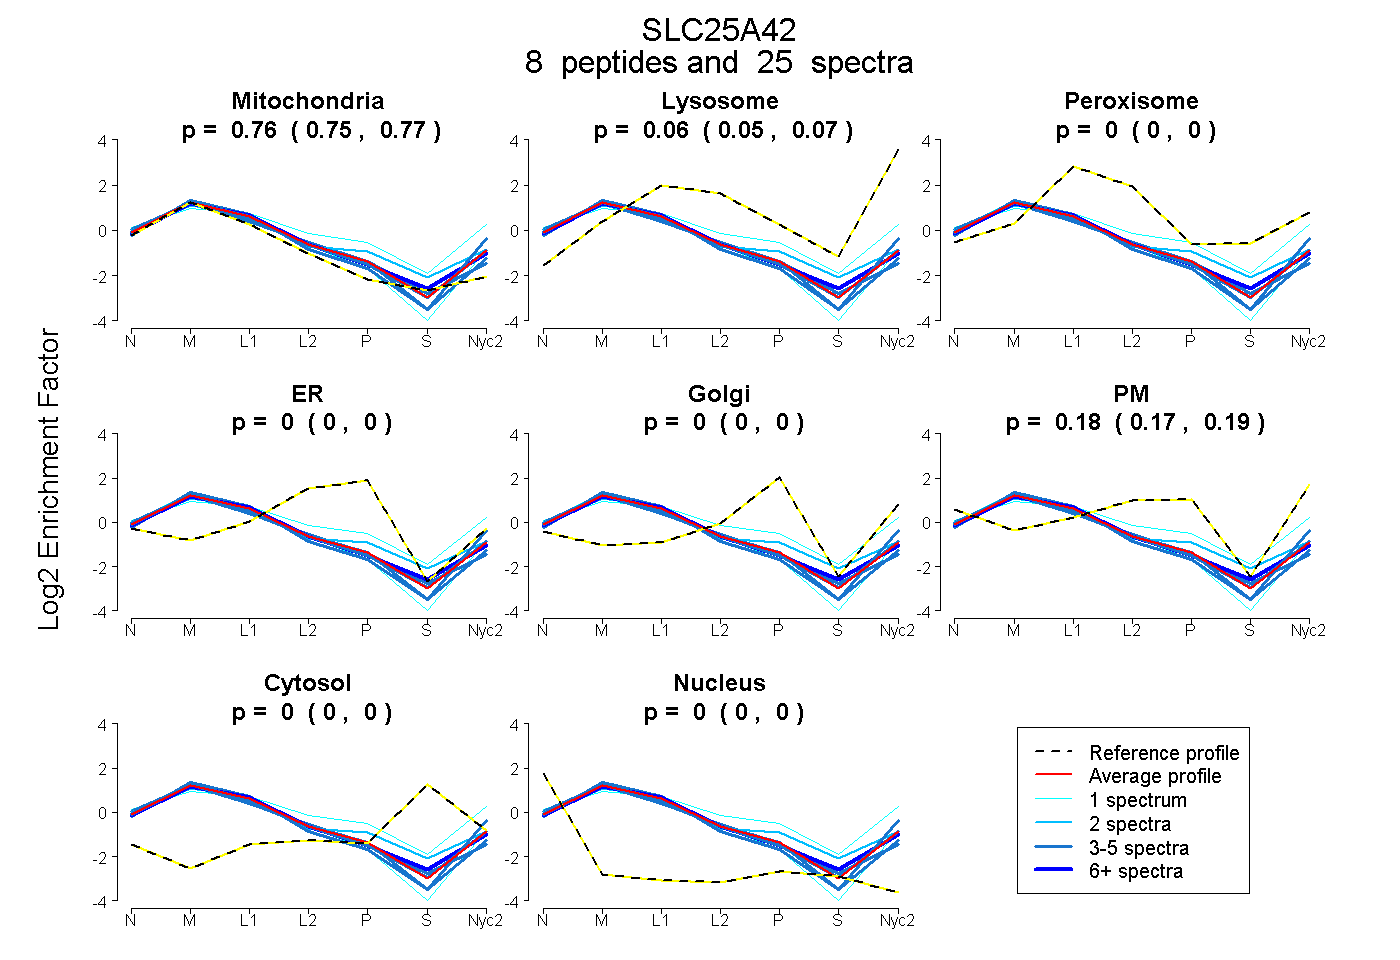
0.752 | 0.767
0.050 | 0.069
0.000 | 0.000
0.000 | 0.000
0.000 | 0.000
0.167 | 0.189
0.000 | 0.000
0.000 | 0.000
5peptides
spectra
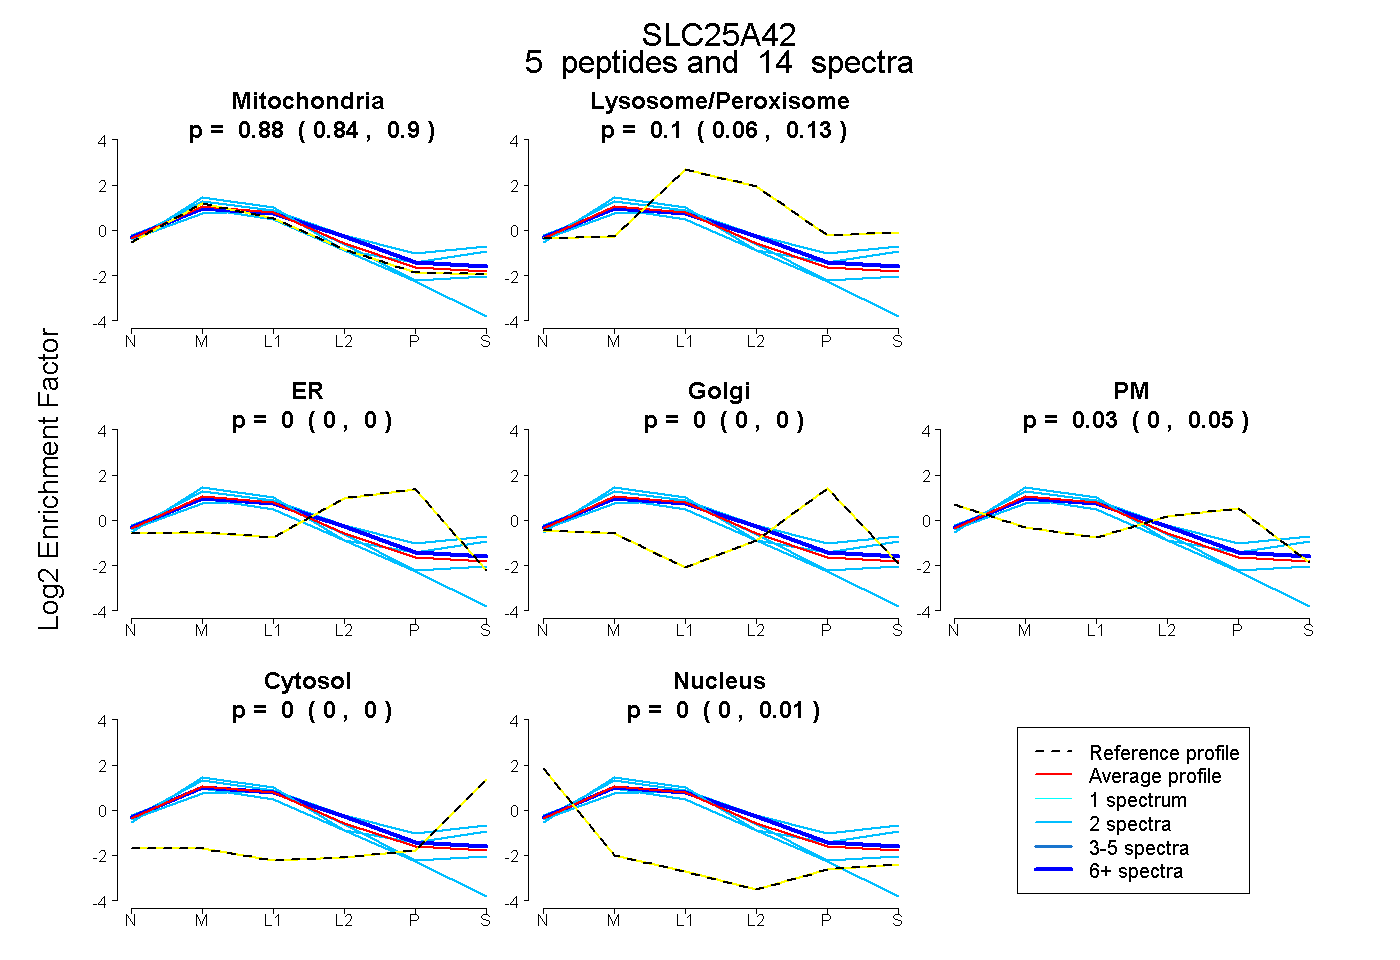
0.842 | 0.902
0.064 | 0.127
0.000 | 0.000
0.000 | 0.000
0.000 | 0.047
0.000 | 0.003
0.000 | 0.013
9peptides
spectra
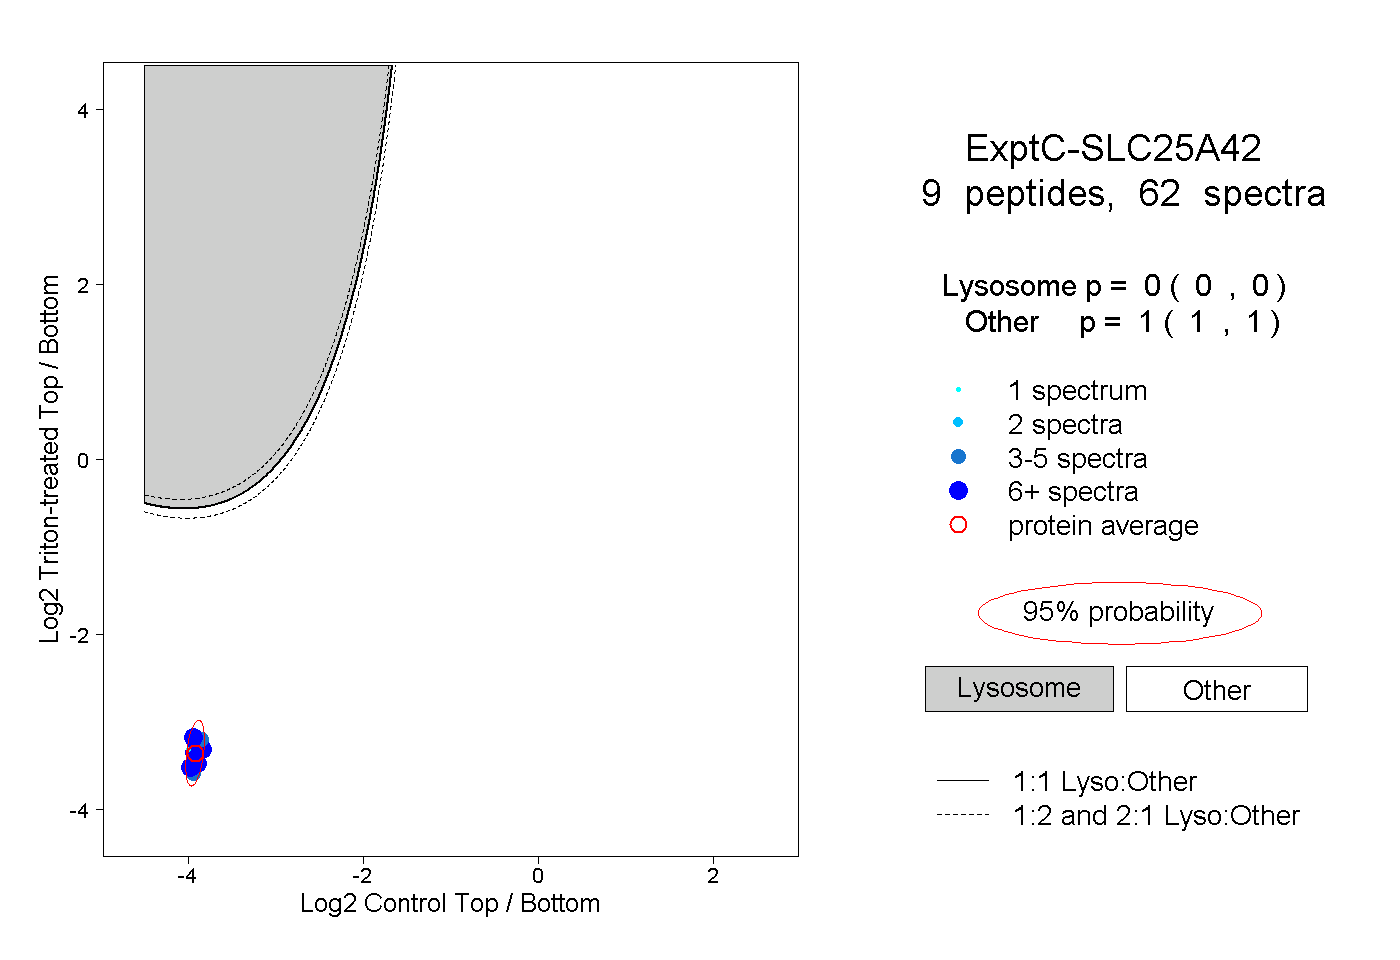
0.000 | 0.000
1.000 | 1.000
4peptides
spectra
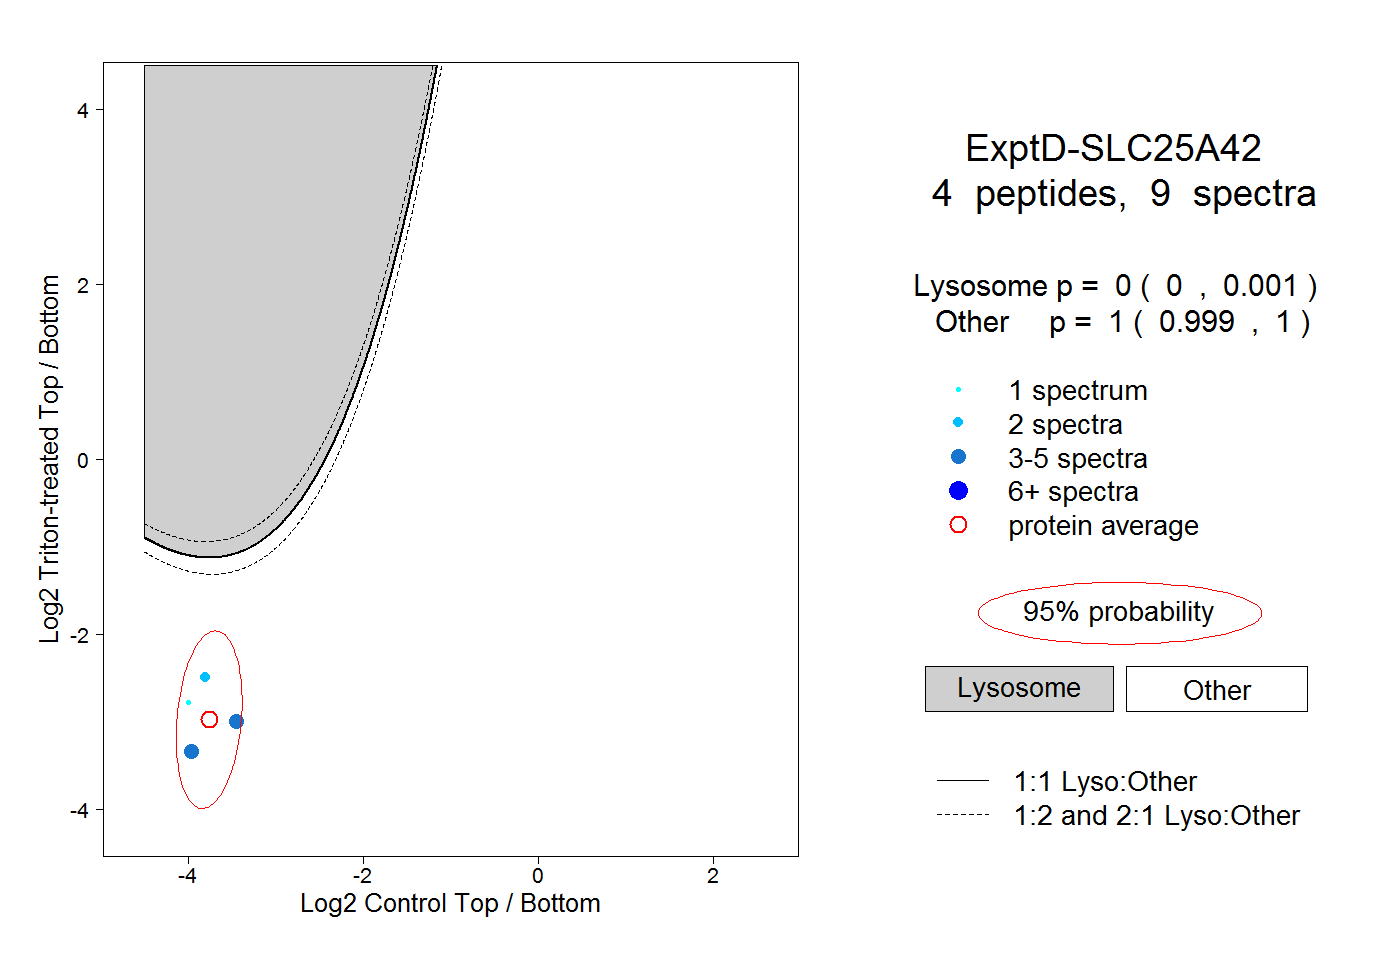
0.000 | 0.001
0.999 | 1.000