SLC25A42
[ENSRNOP00000027615]
Main page
| | | Plot |
Mito |
Lyso |
|
Perox |
ER |
Golgi |
PM |
Cytosol |
Nucleus |
|
| Expt A |
 8
8
peptides |
25
spectra |
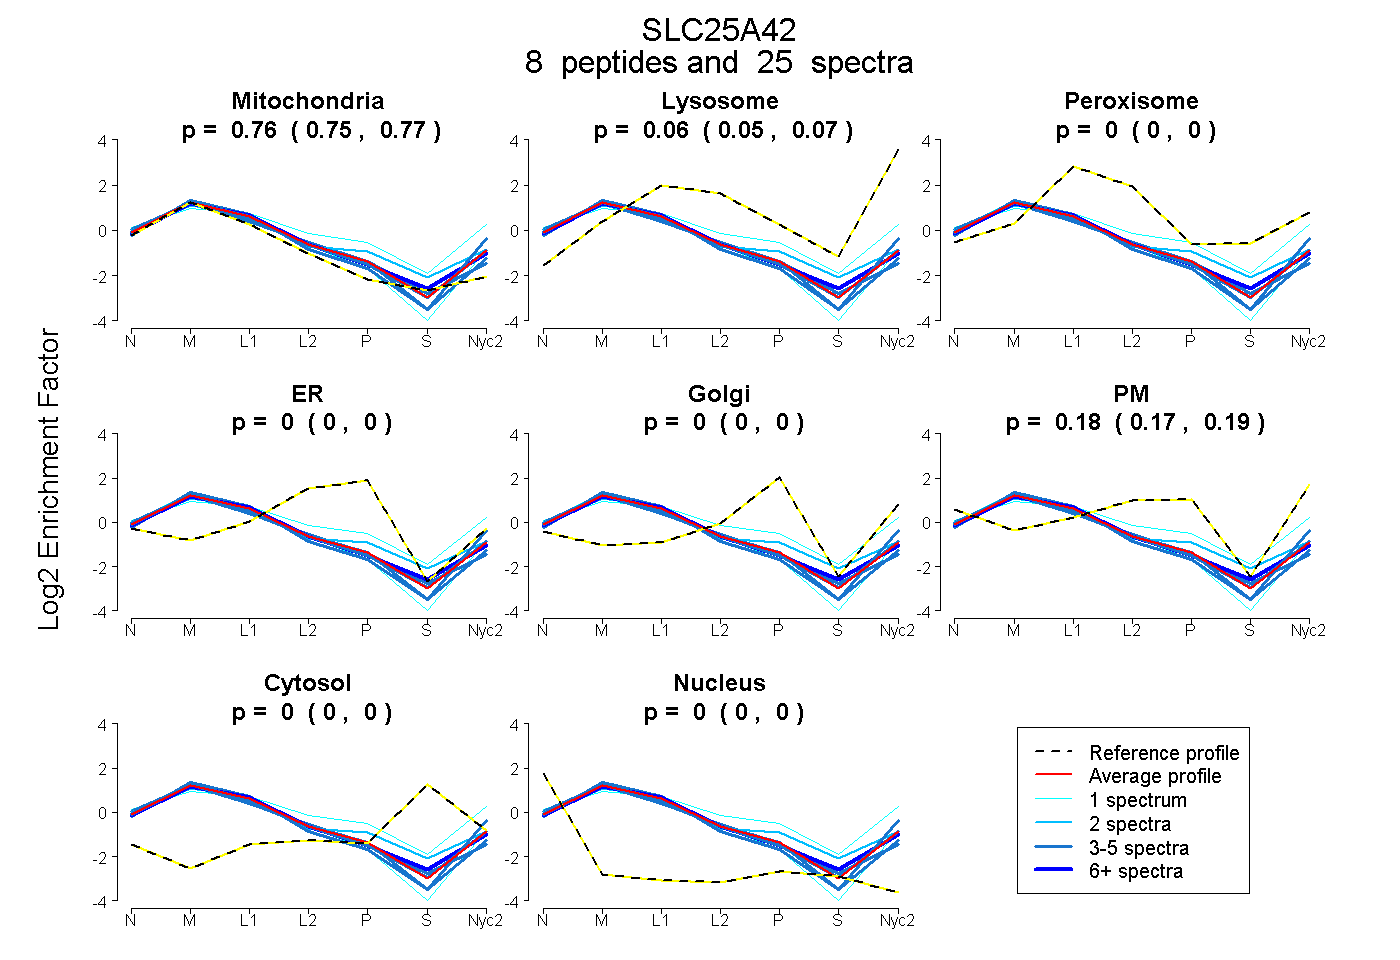 |
0.761
0.752 | 0.767 |
0.060
0.050 | 0.069 |
|
0.000
0.000 | 0.000 |
0.000
0.000 | 0.000 |
0.000
0.000 | 0.000 |
0.179
0.167 | 0.189 |
0.000
0.000 | 0.000 |
0.000
0.000 | 0.000 |
|
| | | Plot |
Mito |
|
Lyso or Perox |
|
ER |
Golgi |
PM |
Cytosol |
Nucleus |
|
| Expt B |
5
peptides |
14
spectra |
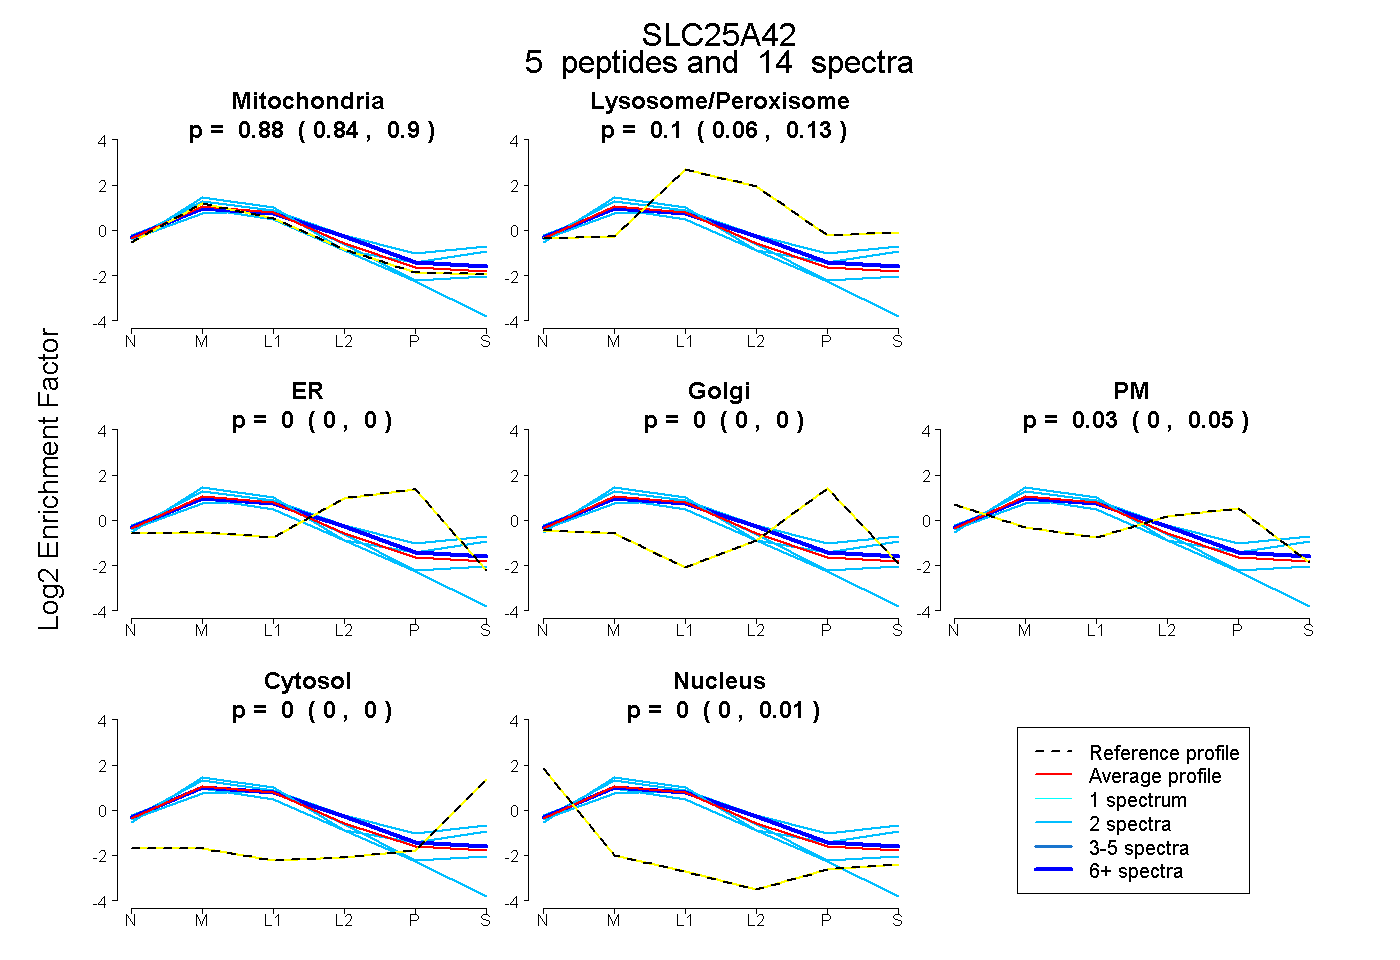 |
0.878
0.842 | 0.902 |
|
0.096
0.064 | 0.127 |
|
0.000
0.000 | 0.000 |
0.000
0.000 | 0.000 |
0.026
0.000 | 0.047 |
0.000
0.000 | 0.003 |
0.000
0.000 | 0.013 |
|
| 2 spectra, TAVAPLDR |
1.000 |
|
0.000 |
|
0.000 |
0.000 |
0.000 |
0.000 |
0.000 |
|
| 2 spectra, IIFQVSSK |
0.980 |
|
0.020 |
|
0.000 |
0.000 |
0.000 |
0.000 |
0.000 |
|
| 2 spectra, EMYSNIFHVFIR |
0.548 |
|
0.317 |
|
0.000 |
0.035 |
0.000 |
0.100 |
0.000 |
|
| 6 spectra, ILGHYYGFR |
0.769 |
|
0.159 |
|
0.000 |
0.000 |
0.072 |
0.000 |
0.000 |
|
| 2 spectra, EYSGRPQPYPFER |
0.729 |
|
0.110 |
|
0.000 |
0.000 |
0.040 |
0.120 |
0.002 |
|
| | | Plot |
|
Lyso |
|
|
|
|
|
|
|
Other |
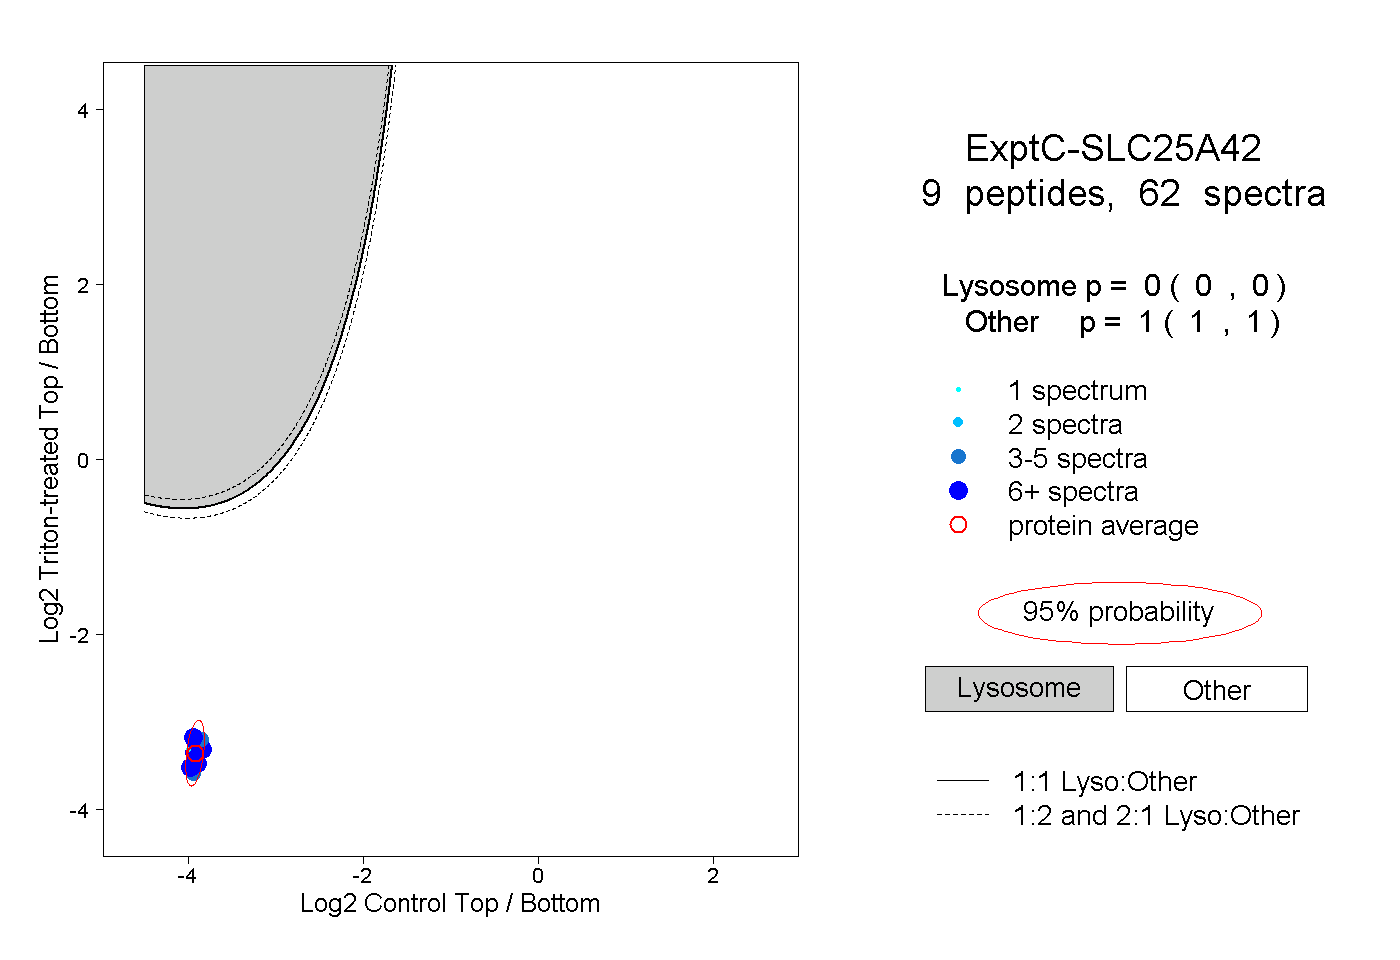
| Expt C |
9
peptides |
62
spectra |
 |
|
0.000
0.000 | 0.000 |
|
|
|
|
|
|
|
1.000
1.000 | 1.000 |
| | | Plot |
|
Lyso |
|
|
|
|
|
|
|
Other |
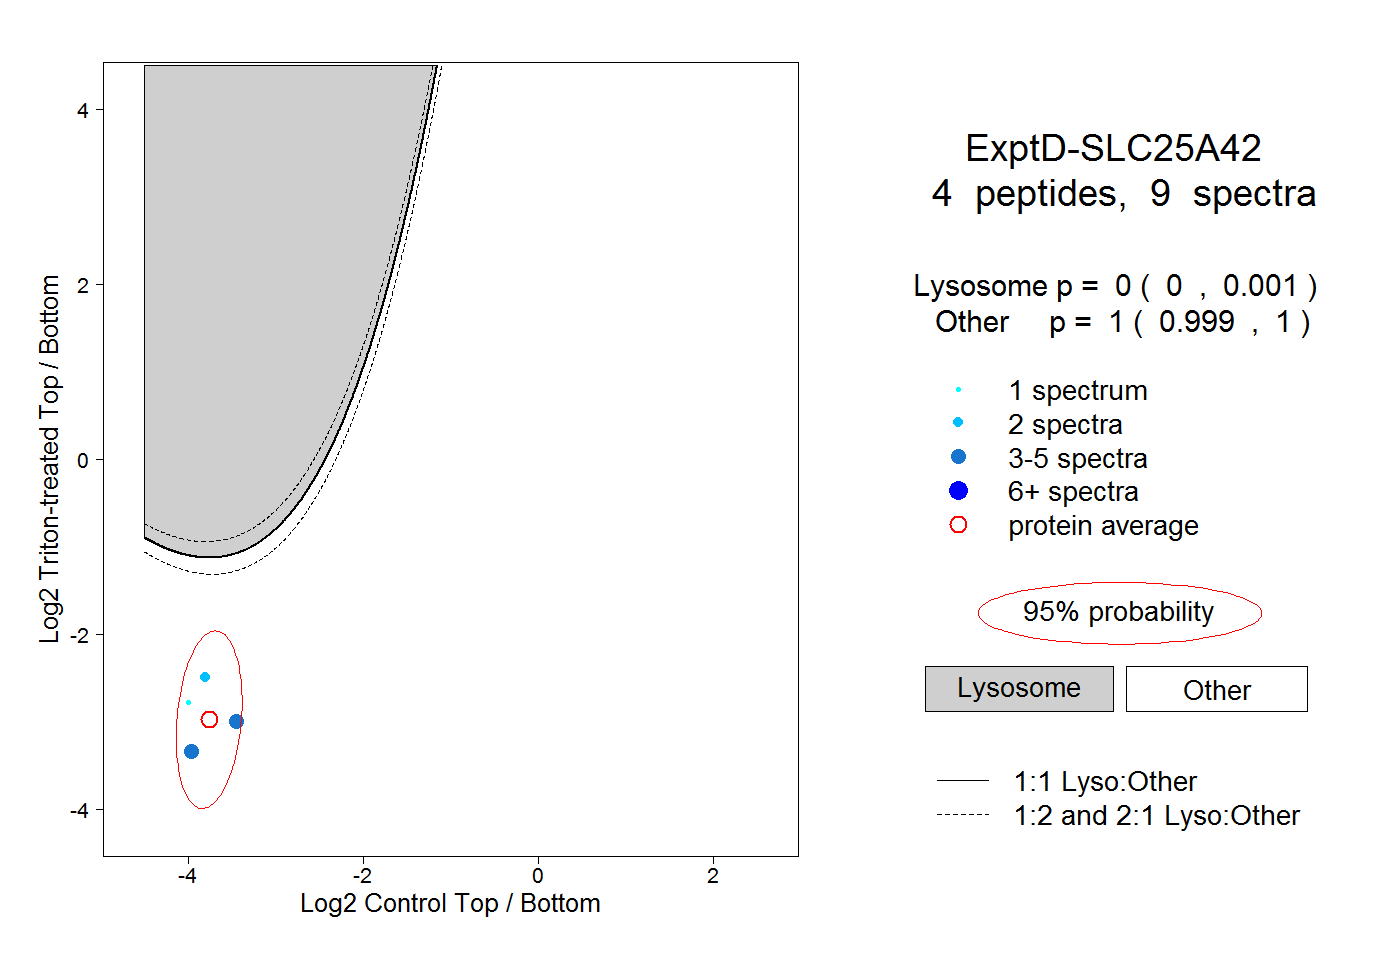
| Expt D |
4
peptides |
9
spectra |
 |
|
0.000
0.000 | 0.001 |
|
|
|
|
|
|
|
1.000
0.999 | 1.000 |