 8
8peptides
spectra
0.752 | 0.767
0.050 | 0.069
0.000 | 0.000
0.000 | 0.000
0.000 | 0.000
0.167 | 0.189
0.000 | 0.000
0.000 | 0.000
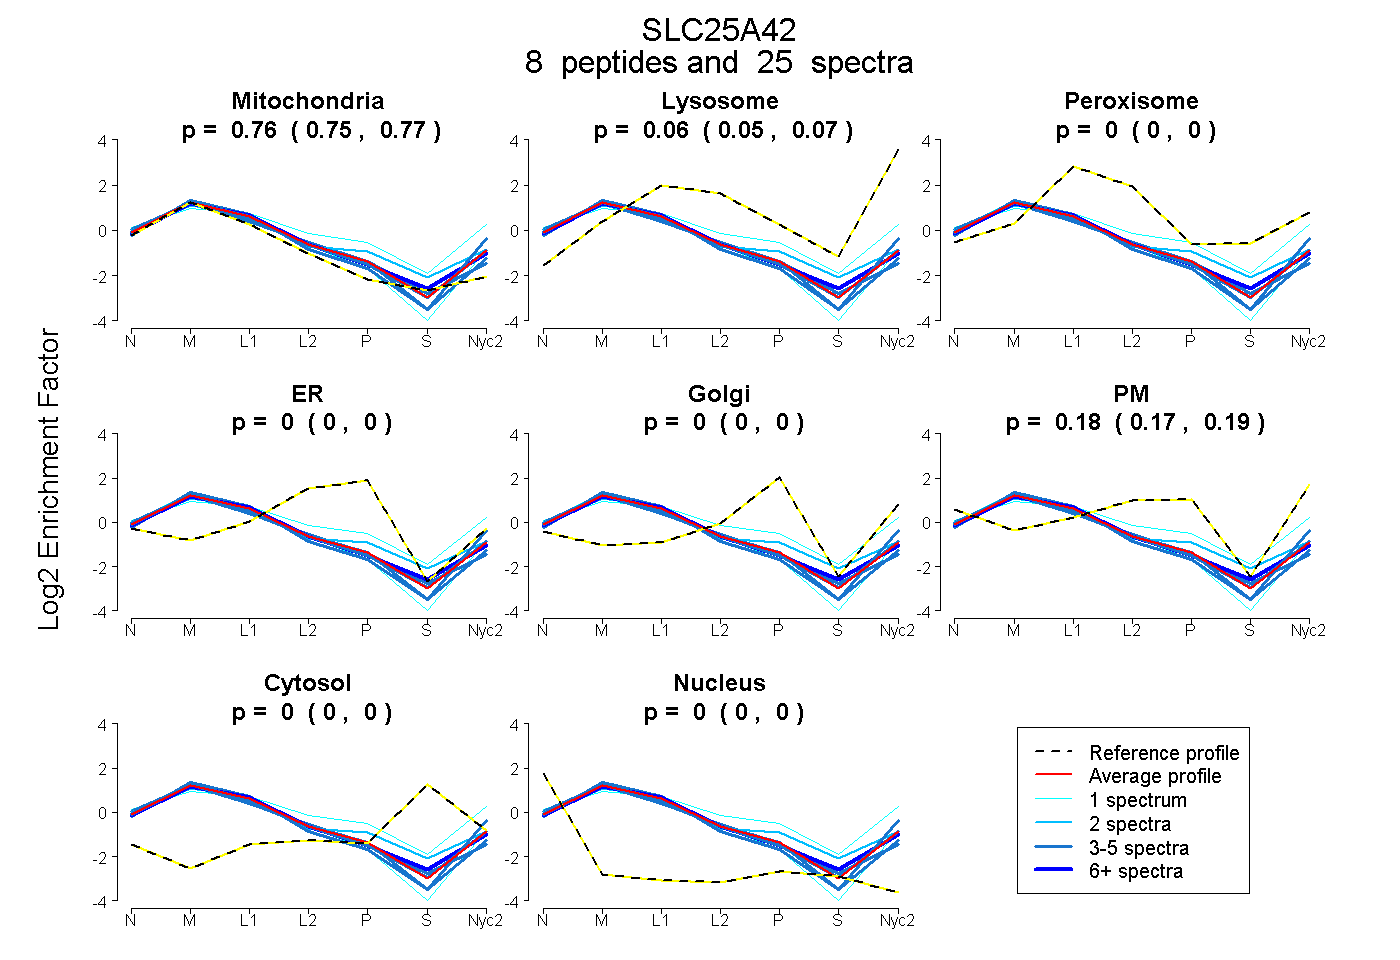
| Plot | Mito | Lyso | Perox | ER | Golgi | PM | Cytosol | Nucleus | |||||
| Expt A |
8 peptides |
25 spectra |
|
0.761 0.752 | 0.767 |
0.060 0.050 | 0.069 |
0.000 0.000 | 0.000 |
0.000 0.000 | 0.000 |
0.000 0.000 | 0.000 |
0.179 0.167 | 0.189 |
0.000 0.000 | 0.000 |
0.000 0.000 | 0.000 |
| 5 spectra, GLSMNWLK | 0.857 | 0.029 | 0.000 | 0.000 | 0.000 | 0.114 | 0.000 | 0.000 | ||
| 3 spectra, TAVAPLDR | 0.773 | 0.060 | 0.000 | 0.000 | 0.000 | 0.167 | 0.000 | 0.000 | ||
| 1 spectrum, EEGAVR | 0.792 | 0.000 | 0.000 | 0.000 | 0.000 | 0.208 | 0.000 | 0.000 | ||
| 1 spectrum, EMYSNIFHVFIR | 0.475 | 0.152 | 0.062 | 0.000 | 0.000 | 0.310 | 0.000 | 0.000 | ||
| 4 spectra, ILGHYYGFR | 0.702 | 0.064 | 0.000 | 0.000 | 0.000 | 0.234 | 0.000 | 0.000 | ||
| 3 spectra, EYSGRPQPYPFER | 0.807 | 0.000 | 0.003 | 0.048 | 0.000 | 0.143 | 0.000 | 0.000 | ||
| 2 spectra, GEALPPWPR | 0.666 | 0.029 | 0.114 | 0.000 | 0.081 | 0.109 | 0.000 | 0.000 | ||
| 6 spectra, GNSATMVR | 0.785 | 0.091 | 0.015 | 0.000 | 0.000 | 0.109 | 0.000 | 0.000 |
| Plot | Mito | Lyso or Perox | ER | Golgi | PM | Cytosol | Nucleus | ||||||
| Expt B |
5 peptides |
14 spectra |
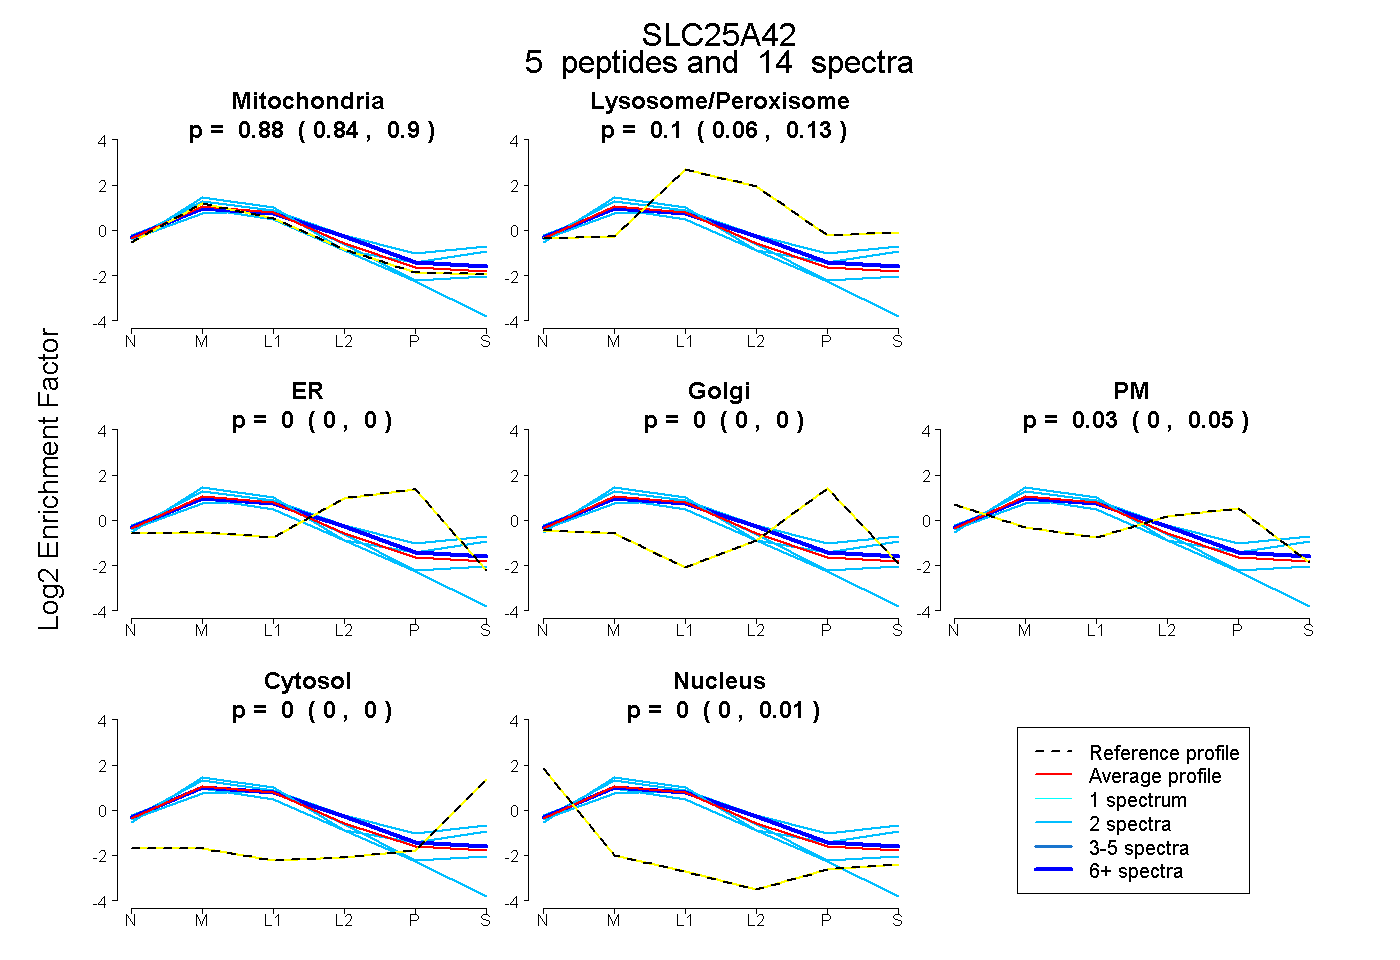 |
0.878 0.842 | 0.902 |
0.096 0.064 | 0.127 |
0.000 0.000 | 0.000 |
0.000 0.000 | 0.000 |
0.026 0.000 | 0.047 |
0.000 0.000 | 0.003 |
0.000 0.000 | 0.013 |
|||
| Plot | Lyso | Other | |||||||||||
| Expt C |
9 peptides |
62 spectra |
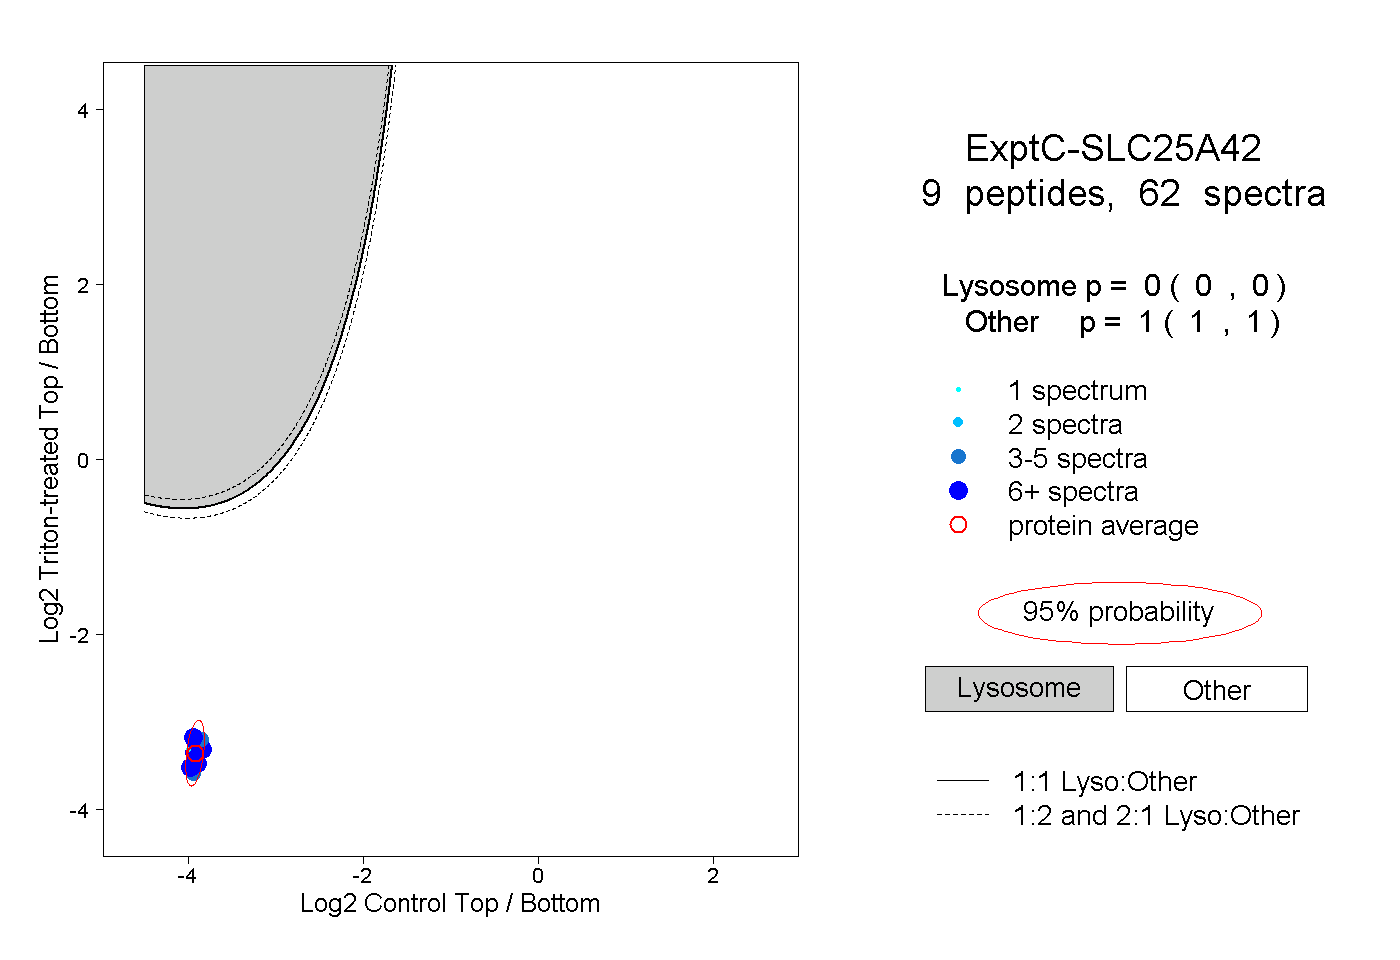 |
0.000 0.000 | 0.000 |
1.000 1.000 | 1.000 |
||||||||
| Plot | Lyso | Other | |||||||||||
| Expt D |
4 peptides |
9 spectra |
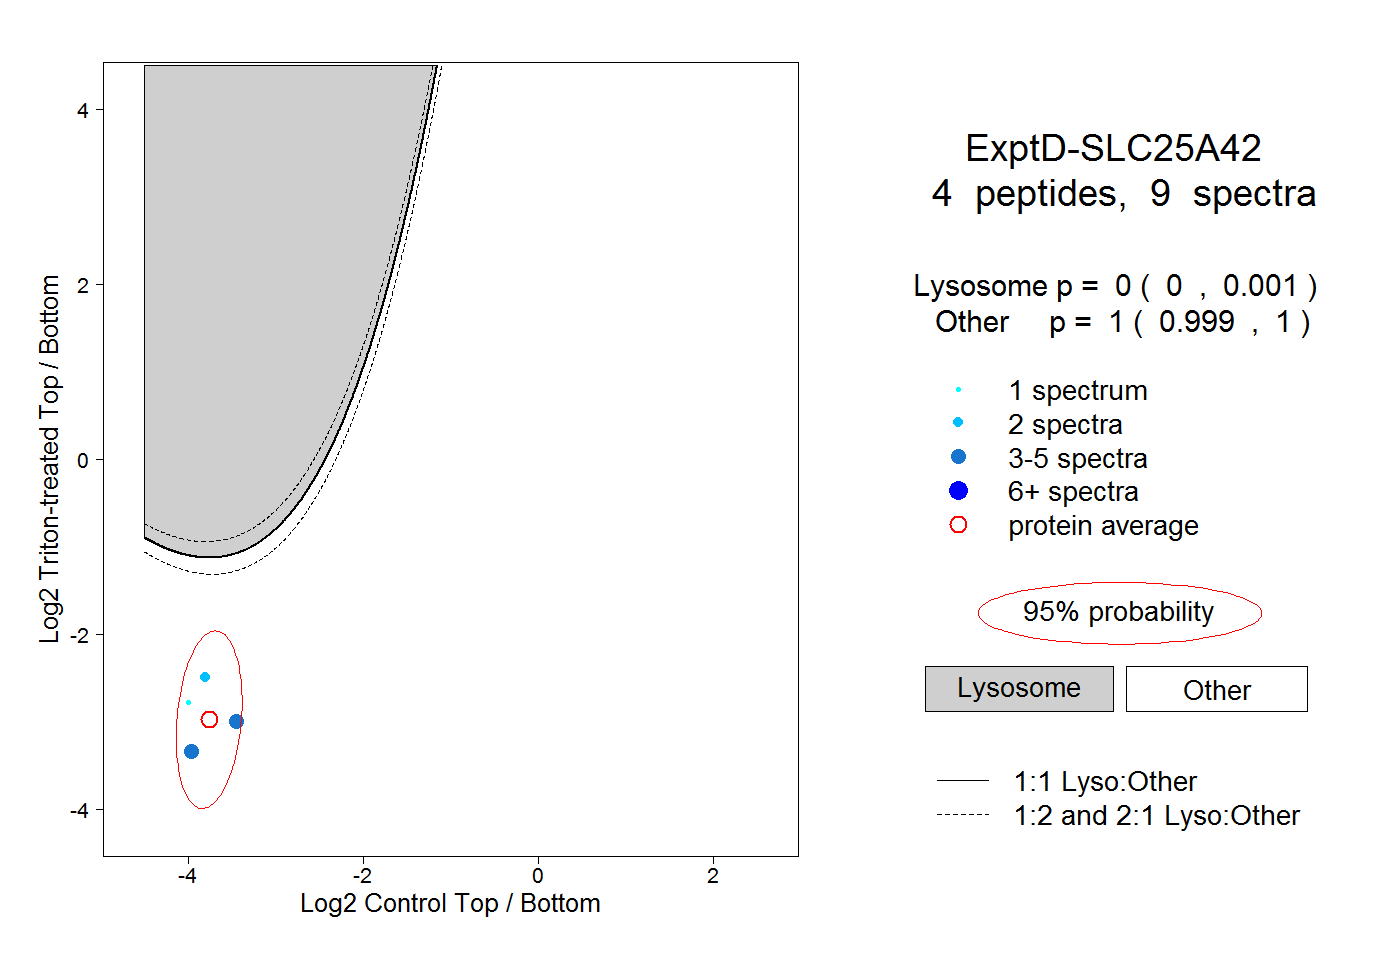 |
0.000 0.000 | 0.001 |
1.000 0.999 | 1.000 |