 7
7peptides
spectra

0.000 | 0.000
0.000 | 0.016
0.042 | 0.062
0.000 | 0.000
0.000 | 0.000
0.925 | 0.949
0.000 | 0.008
0.000 | 0.000
4peptides
spectra

0.000 | 0.000
0.000 | 0.043
0.000 | 0.140
0.000 | 0.014
0.747 | 0.941
0.000 | 0.093
0.000 | 0.053
6peptides
spectra
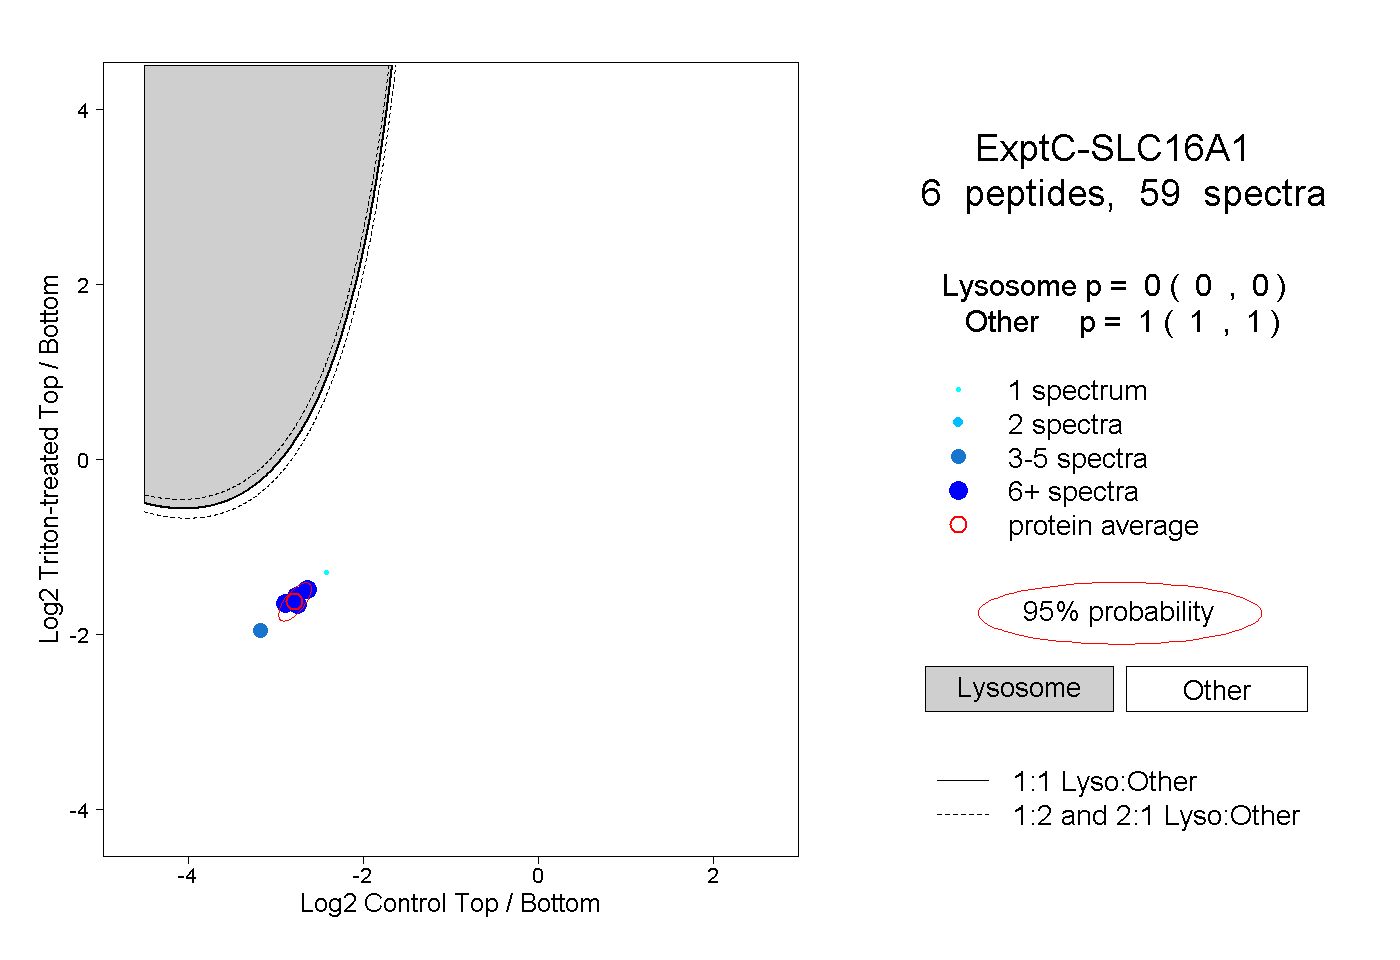
0.000 | 0.000
1.000 | 1.000
2peptides
spectra
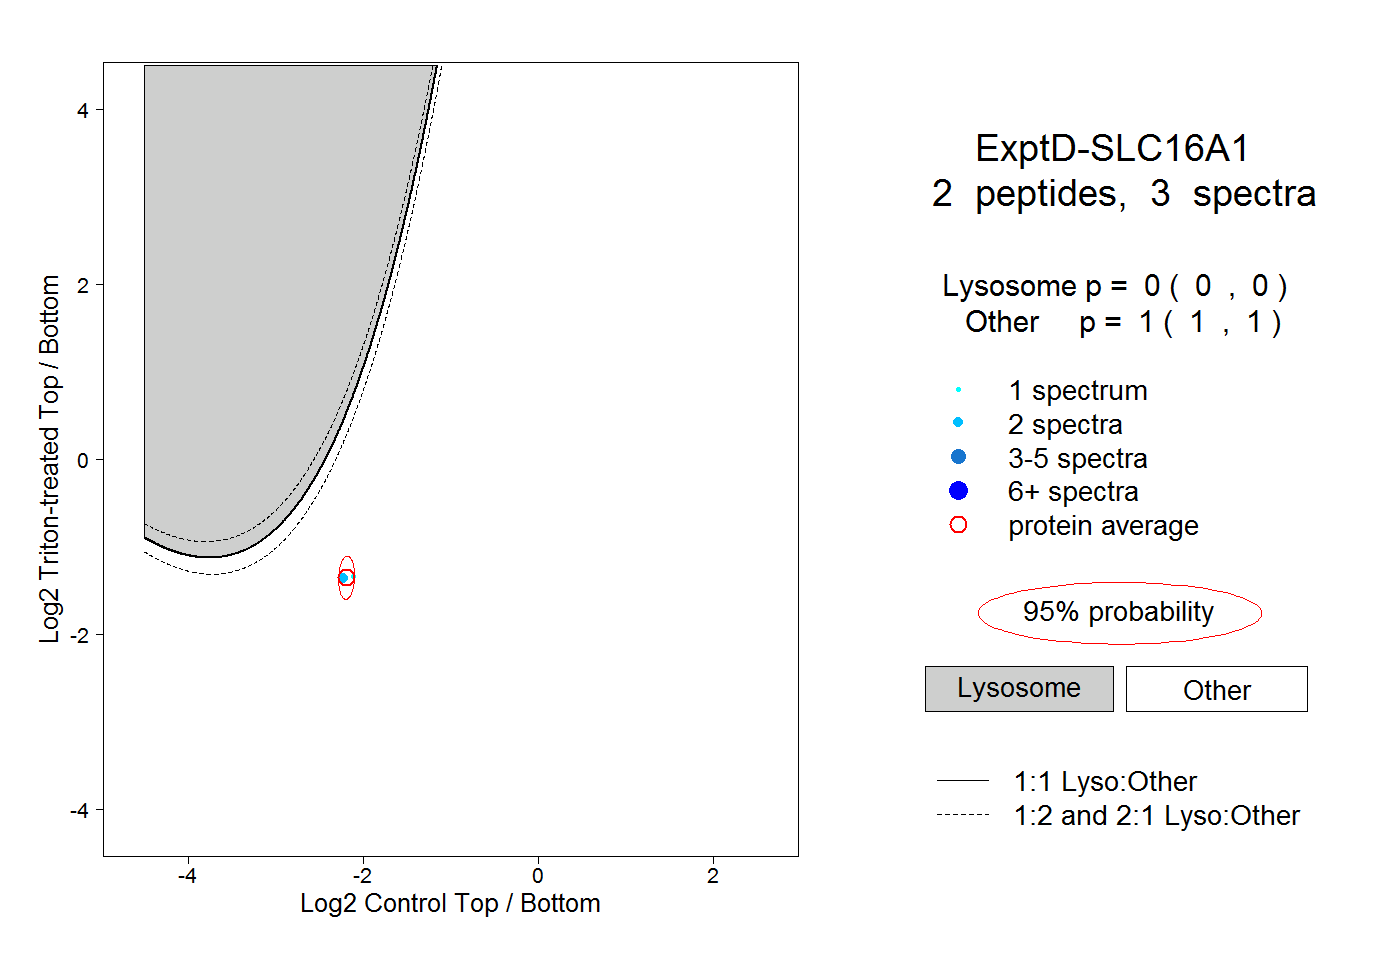
0.000 | 0.000
1.000 | 1.000