 7
7peptides
spectra

0.000 | 0.000
0.000 | 0.016
0.042 | 0.062
0.000 | 0.000
0.000 | 0.000
0.925 | 0.949
0.000 | 0.008
0.000 | 0.000
| Plot | Mito | Lyso | Perox | ER | Golgi | PM | Cytosol | Nucleus | |||||
| Expt A |
7 peptides |
43 spectra |
|
0.000 0.000 | 0.000 |
0.003 0.000 | 0.016 |
0.055 0.042 | 0.062 |
0.000 0.000 | 0.000 |
0.000 0.000 | 0.000 |
0.940 0.925 | 0.949 |
0.003 0.000 | 0.008 |
0.000 0.000 | 0.000 |
| 13 spectra, LSVFQTVNK | 0.000 | 0.032 | 0.057 | 0.000 | 0.000 | 0.887 | 0.024 | 0.000 | ||
| 1 spectrum, SITVFFK | 0.000 | 0.000 | 0.028 | 0.000 | 0.000 | 0.804 | 0.063 | 0.106 | ||
| 8 spectra, LNDMYGDYK | 0.000 | 0.184 | 0.000 | 0.000 | 0.000 | 0.816 | 0.000 | 0.000 | ||
| 7 spectra, FLDLSLFTHR | 0.000 | 0.000 | 0.000 | 0.000 | 0.000 | 1.000 | 0.000 | 0.000 | ||
| 7 spectra, SDANTDLIGGSPK | 0.000 | 0.000 | 0.000 | 0.066 | 0.000 | 0.934 | 0.000 | 0.000 | ||
| 5 spectra, ESLQEAGK | 0.000 | 0.000 | 0.082 | 0.062 | 0.000 | 0.732 | 0.124 | 0.000 | ||
| 2 spectra, HFSSEK | 0.000 | 0.033 | 0.091 | 0.000 | 0.000 | 0.717 | 0.160 | 0.000 |
| Plot | Mito | Lyso or Perox | ER | Golgi | PM | Cytosol | Nucleus | ||||||
| Expt B |
4 peptides |
9 spectra |
 |
0.000 0.000 | 0.000 |
0.007 0.000 | 0.043 |
0.011 0.000 | 0.140 |
0.000 0.000 | 0.014 |
0.921 0.747 | 0.941 |
0.061 0.000 | 0.093 |
0.000 0.000 | 0.053 |
|||
| Plot | Lyso | Other | |||||||||||
| Expt C |
6 peptides |
59 spectra |
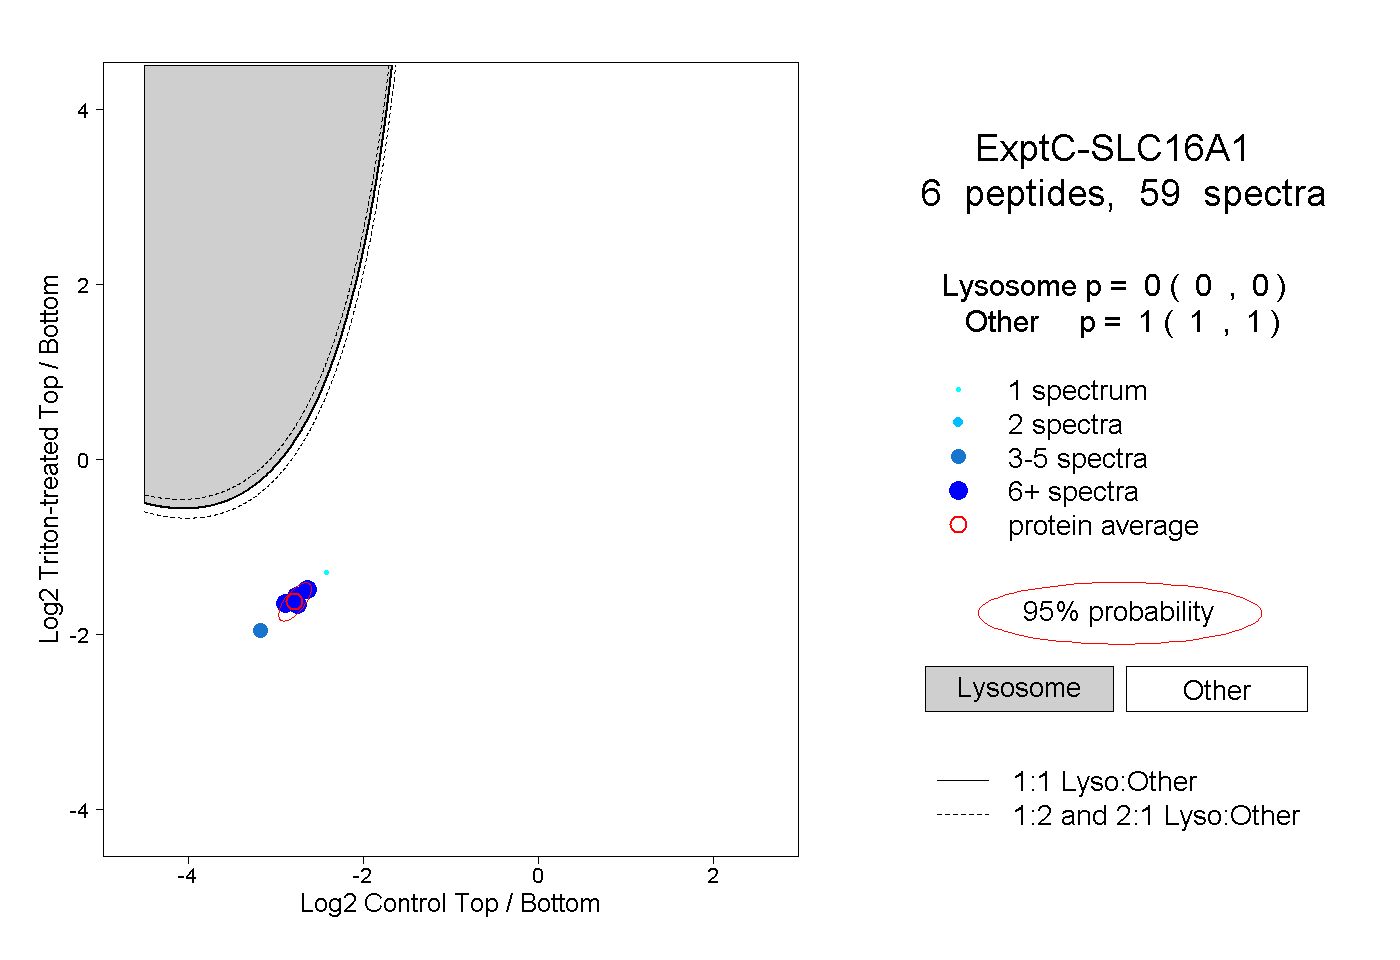 |
0.000 0.000 | 0.000 |
1.000 1.000 | 1.000 |
||||||||
| Plot | Lyso | Other | |||||||||||
| Expt D |
2 peptides |
3 spectra |
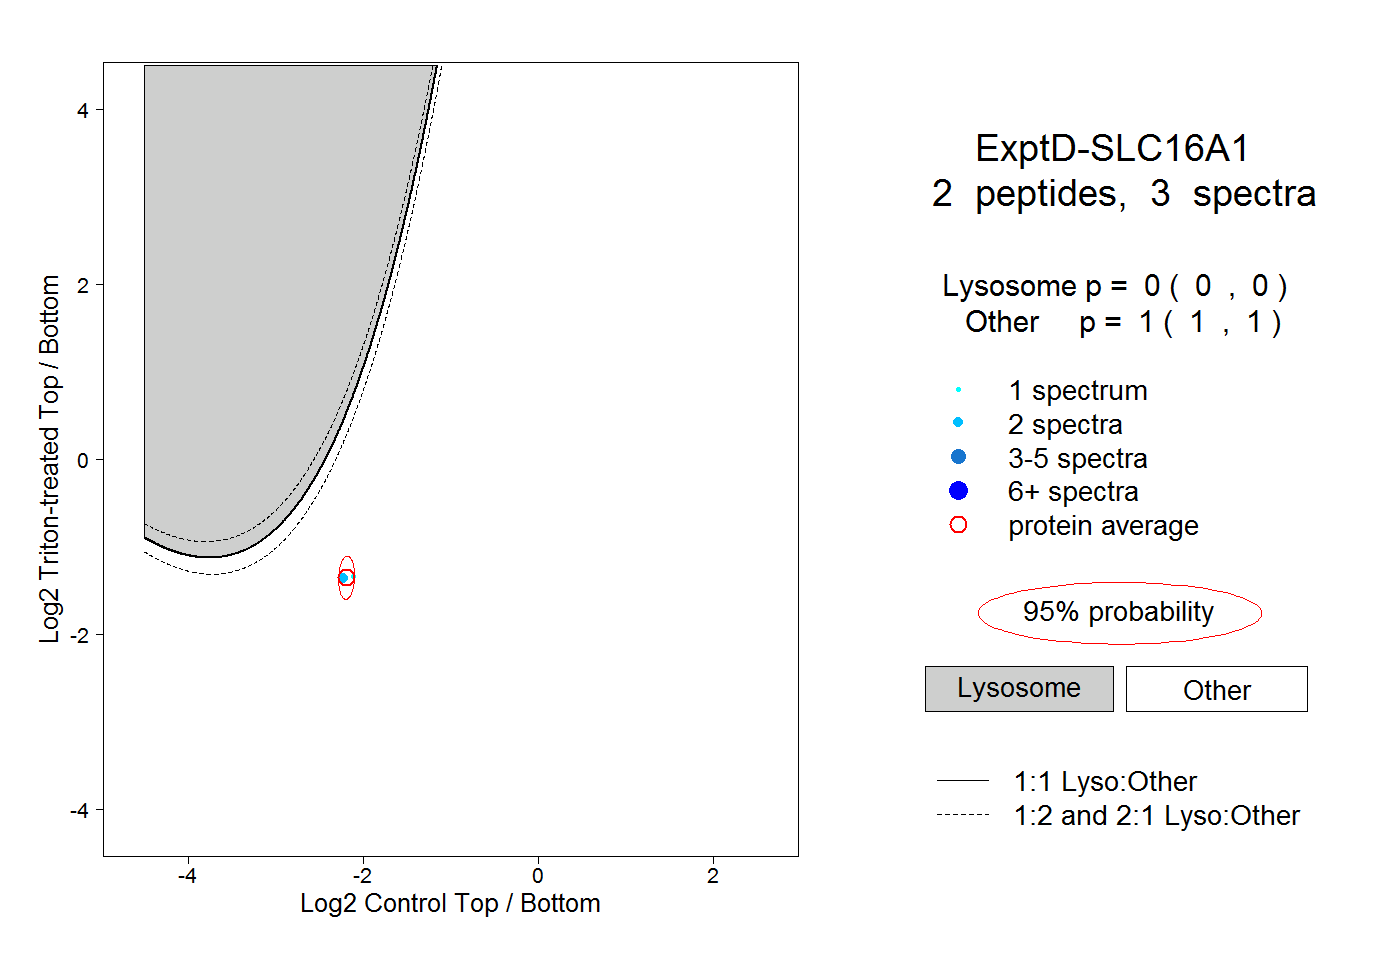 |
0.000 0.000 | 0.000 |
1.000 1.000 | 1.000 |