SLC16A1
[ENSRNOP00000027234]
Main page
| | | Plot |
Mito |
Lyso |
|
Perox |
ER |
Golgi |
PM |
Cytosol |
Nucleus |
|
| Expt A |
 7
7
peptides |
43
spectra |
 |
0.000
0.000 | 0.000 |
0.003
0.000 | 0.016 |
|
0.055
0.042 | 0.062 |
0.000
0.000 | 0.000 |
0.000
0.000 | 0.000 |
0.940
0.925 | 0.949 |
0.003
0.000 | 0.008 |
0.000
0.000 | 0.000 |
|
| | | Plot |
Mito |
|
Lyso or Perox |
|
ER |
Golgi |
PM |
Cytosol |
Nucleus |
|
| Expt B |
4
peptides |
9
spectra |
 |
0.000
0.000 | 0.000 |
|
0.007
0.000 | 0.043 |
|
0.011
0.000 | 0.140 |
0.000
0.000 | 0.014 |
0.921
0.747 | 0.941 |
0.061
0.000 | 0.093 |
0.000
0.000 | 0.053 |
|
| 3 spectra, LSVFQTVNK |
0.000 |
|
0.034 |
|
0.000 |
0.020 |
0.909 |
0.001 |
0.035 |
|
| 2 spectra, FLDLSLFTHR |
0.000 |
|
0.030 |
|
0.000 |
0.000 |
0.970 |
0.000 |
0.000 |
|
| 3 spectra, SDANTDLIGGSPK |
0.000 |
|
0.000 |
|
0.139 |
0.039 |
0.652 |
0.170 |
0.000 |
|
| 1 spectrum, ESLQEAGK |
0.000 |
|
0.007 |
|
0.000 |
0.000 |
0.846 |
0.148 |
0.000 |
|
| | | Plot |
|
Lyso |
|
|
|
|
|
|
|
Other |
| Expt C |
6
peptides |
59
spectra |
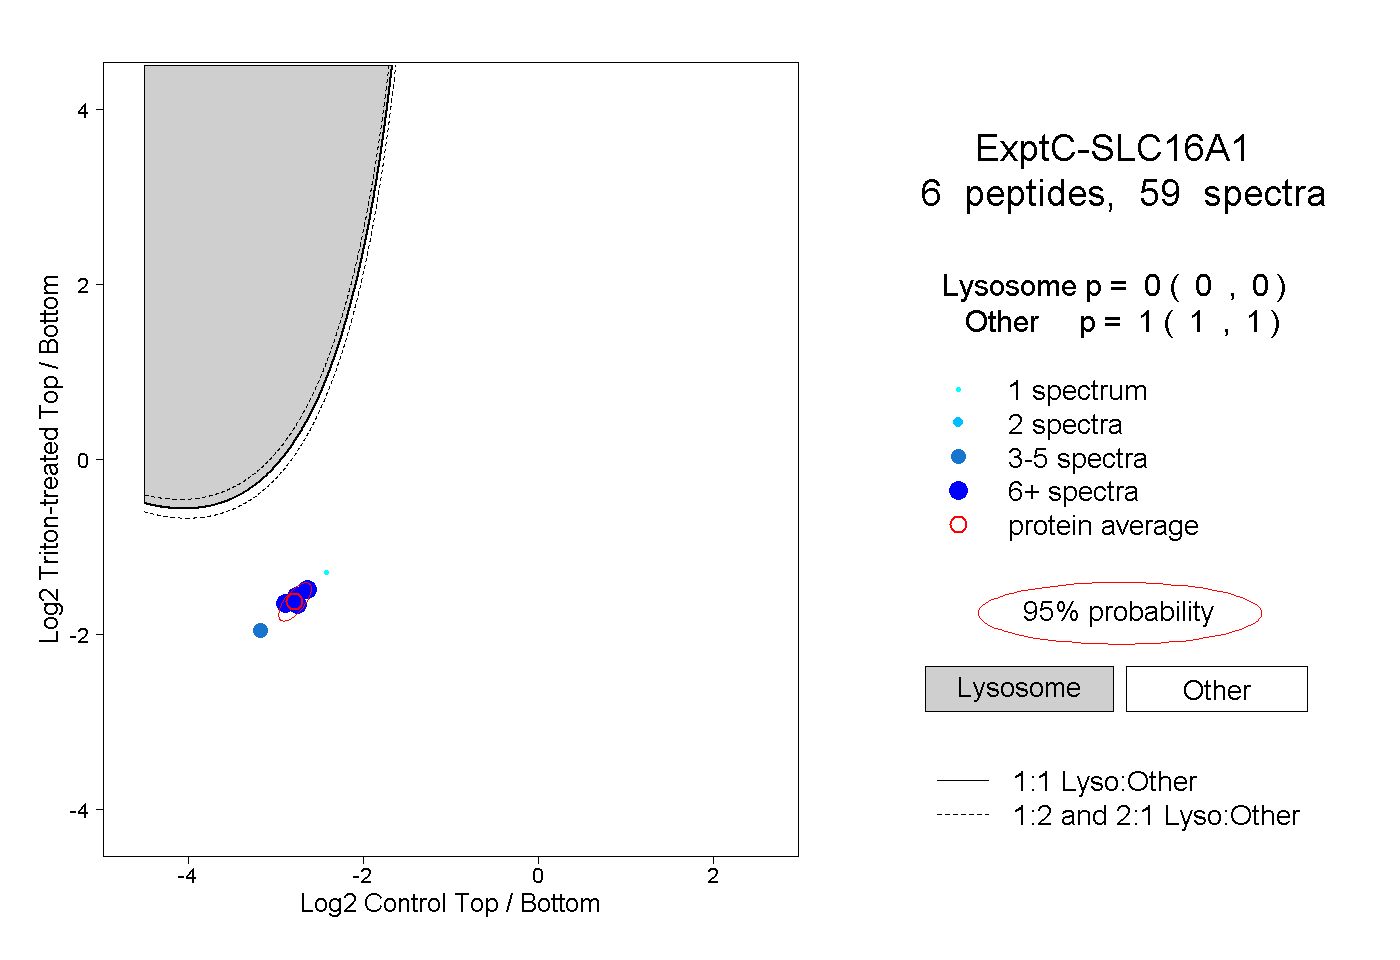 |
|
0.000
0.000 | 0.000 |
|
|
|
|
|
|
|
1.000
1.000 | 1.000 |
| | | Plot |
|
Lyso |
|
|
|
|
|
|
|
Other |
| Expt D |
2
peptides |
3
spectra |
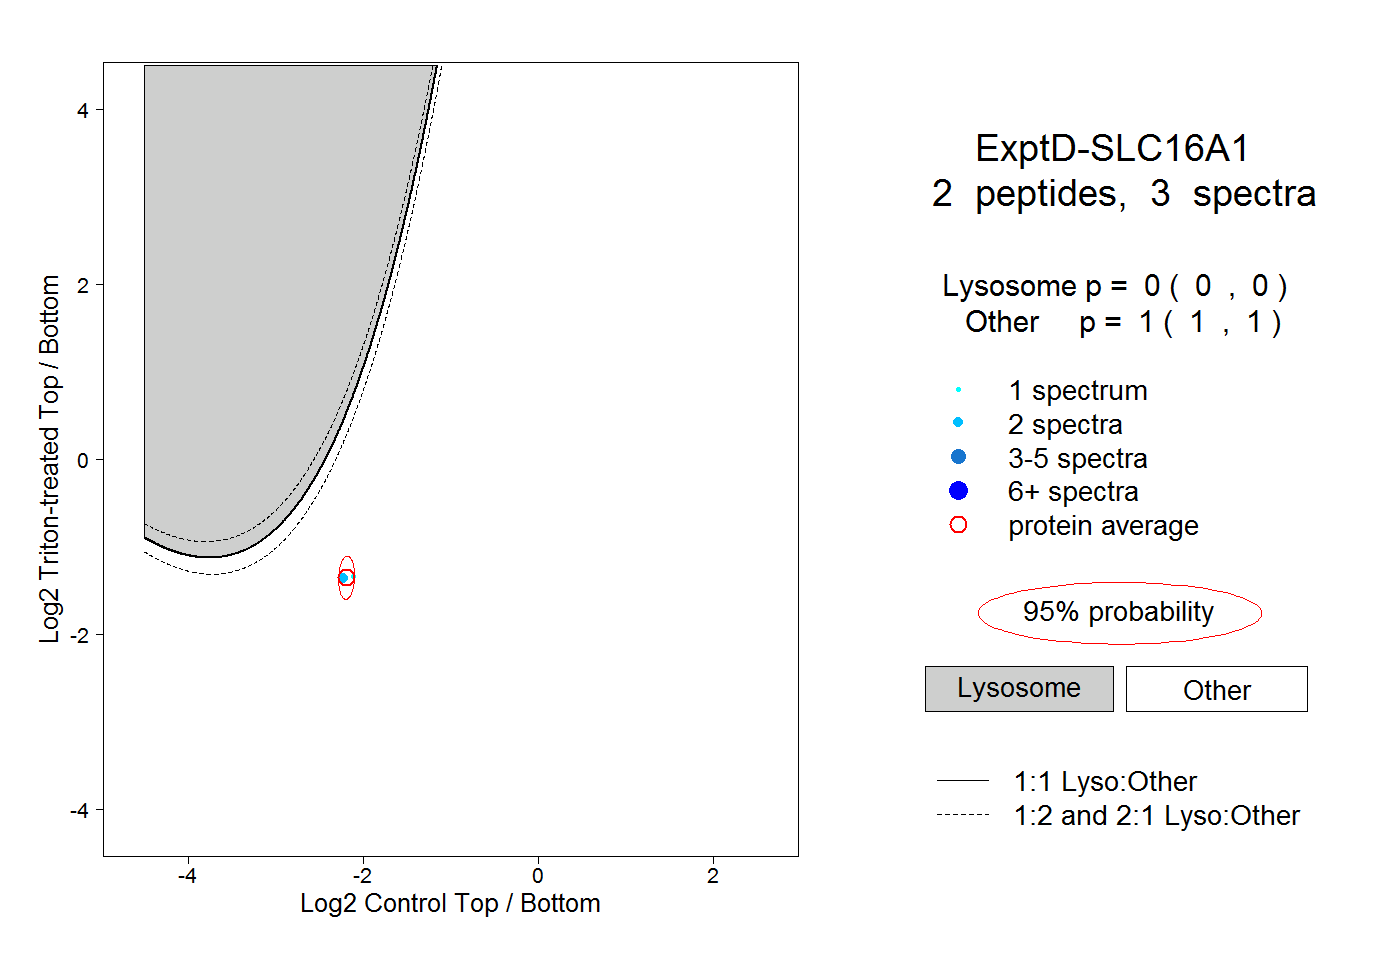 |
|
0.000
0.000 | 0.000 |
|
|
|
|
|
|
|
1.000
1.000 | 1.000 |