 12
12peptides
spectra
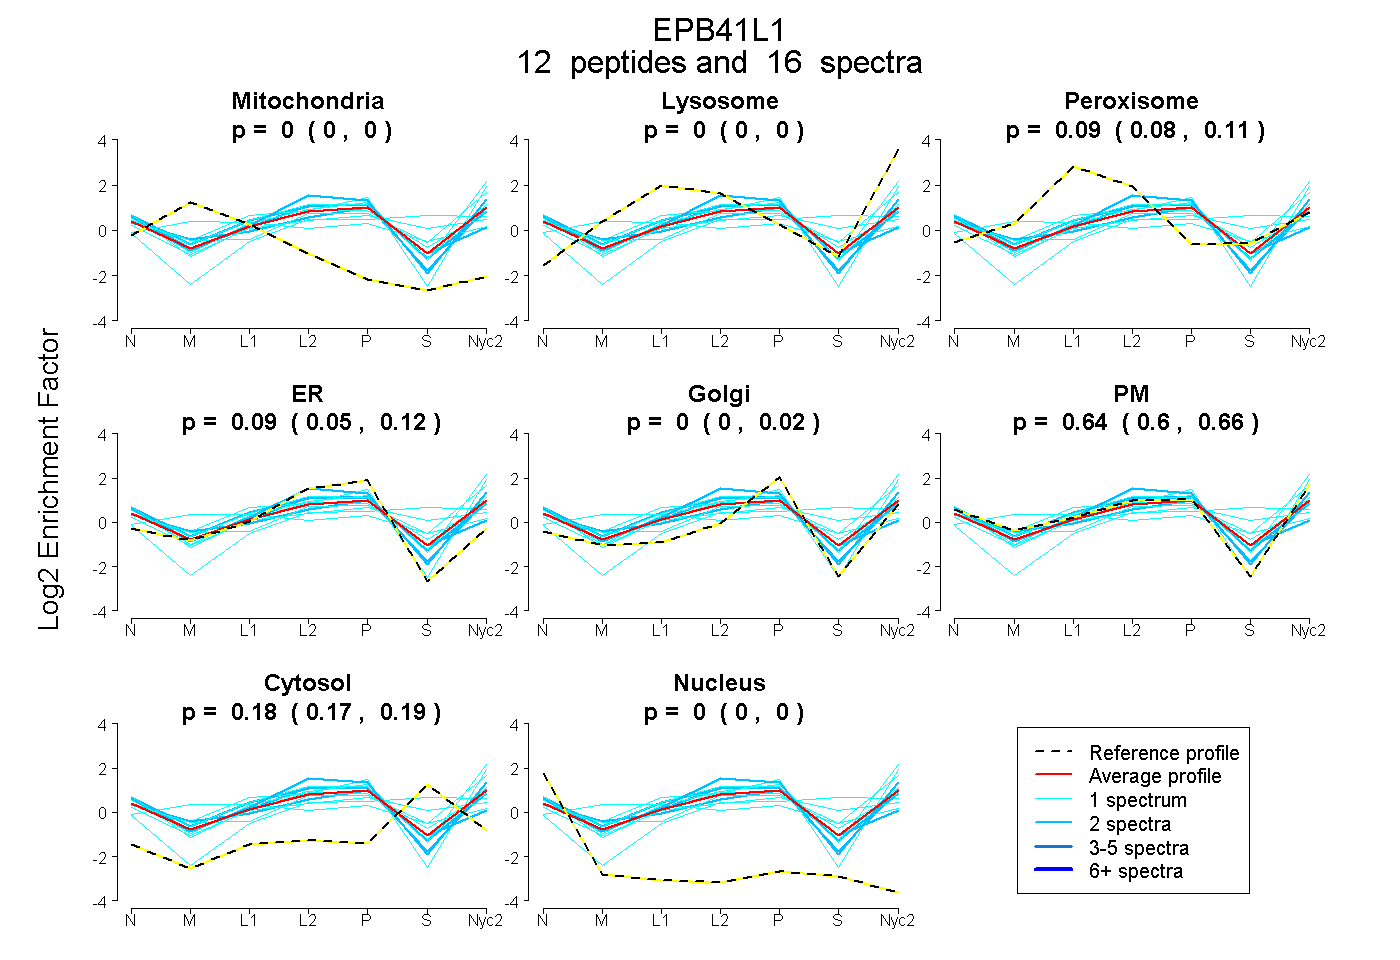
0.000 | 0.000
0.000 | 0.000
0.076 | 0.109
0.047 | 0.115
0.000 | 0.021
0.598 | 0.665
0.169 | 0.193
0.000 | 0.000
1peptide
spectrum
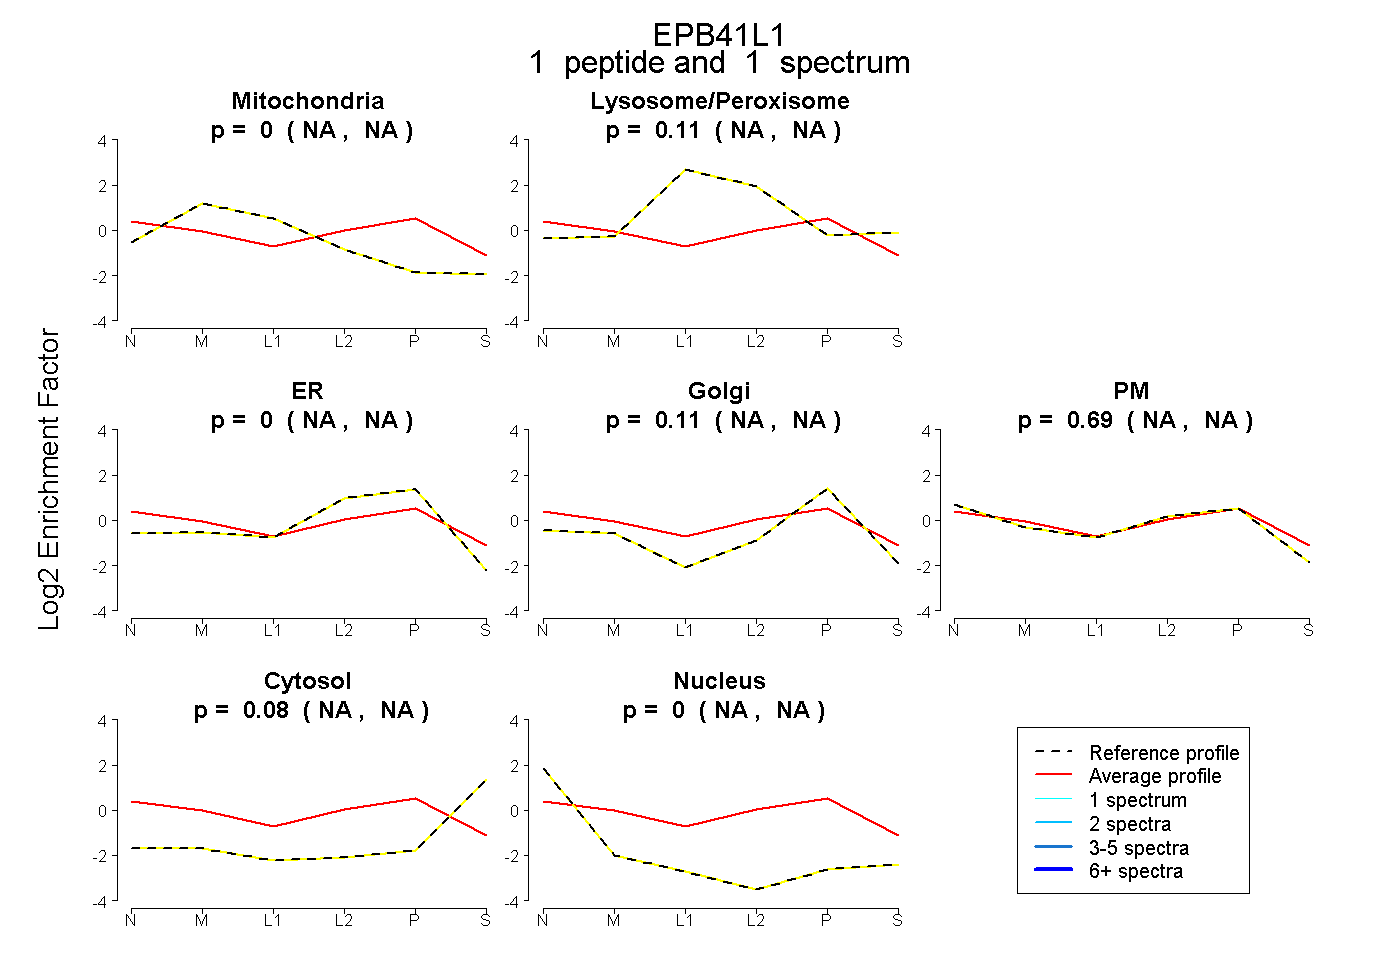
NA | NA
NA | NA
NA | NA
NA | NA
NA | NA
NA | NA
NA | NA
9peptides
spectra
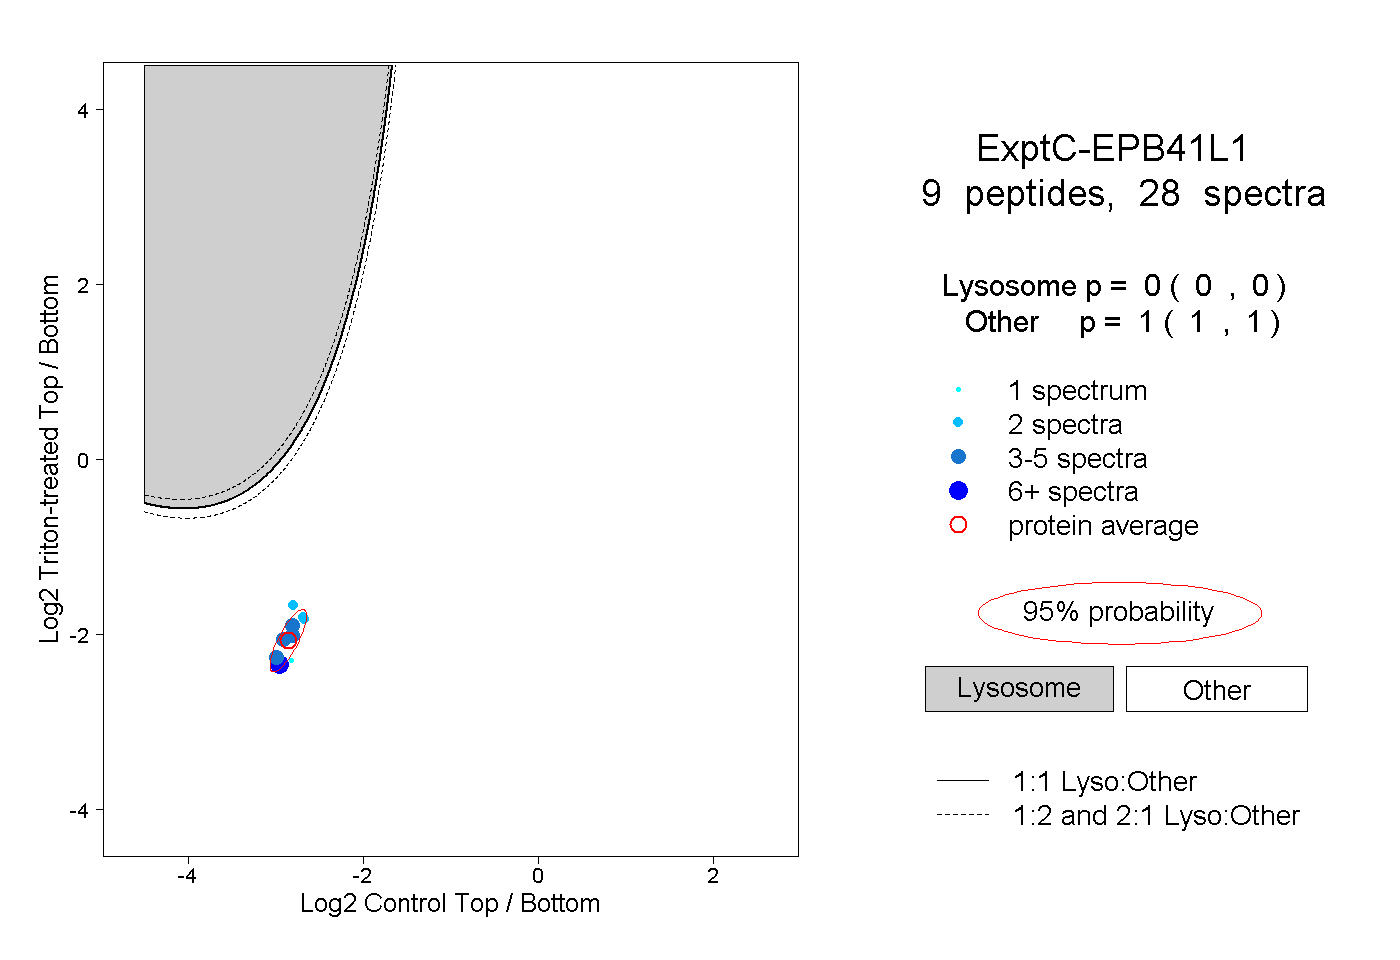
0.000 | 0.000
1.000 | 1.000