 12
12peptides
spectra
0.000 | 0.000
0.000 | 0.000
0.076 | 0.109
0.047 | 0.115
0.000 | 0.021
0.598 | 0.665
0.169 | 0.193
0.000 | 0.000
| Plot | Mito | Lyso | Perox | ER | Golgi | PM | Cytosol | Nucleus | |||||
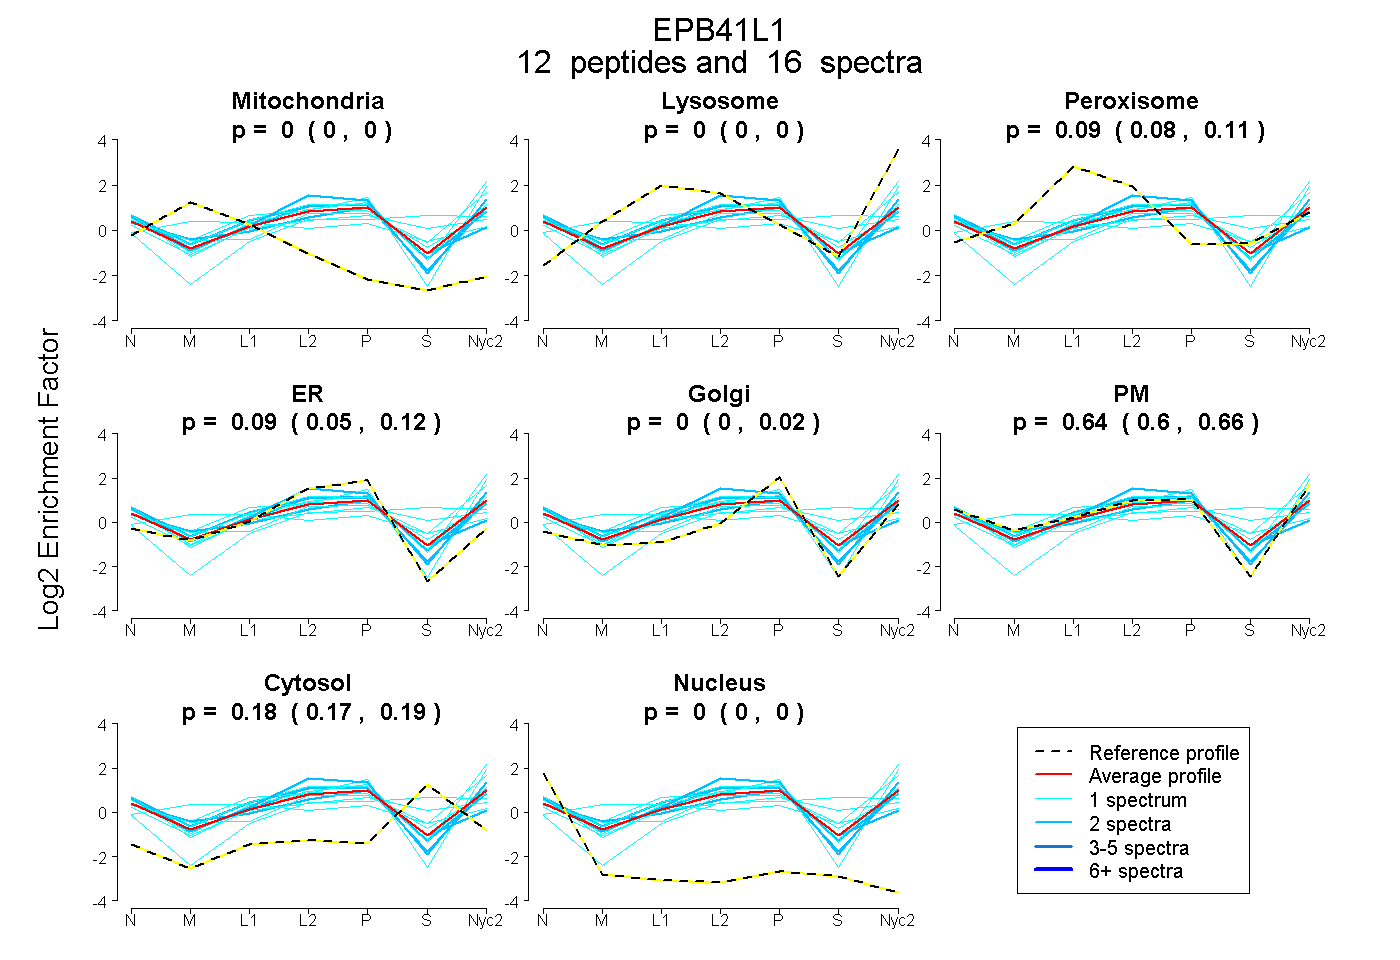
| Expt A |
12 peptides |
16 spectra |
|
0.000 0.000 | 0.000 |
0.000 0.000 | 0.000 |
0.093 0.076 | 0.109 |
0.086 0.047 | 0.115 |
0.000 0.000 | 0.021 |
0.638 0.598 | 0.665 |
0.183 0.169 | 0.193 |
0.000 0.000 | 0.000 |
| 1 spectrum, FAPNQTR | 0.000 | 0.088 | 0.000 | 0.007 | 0.054 | 0.852 | 0.000 | 0.000 | ||
| 1 spectrum, GMTPGEAEIHFLENAK | 0.000 | 0.000 | 0.072 | 0.114 | 0.000 | 0.678 | 0.135 | 0.000 | ||
| 1 spectrum, SSPWNFAFTVK | 0.000 | 0.122 | 0.000 | 0.000 | 0.000 | 0.640 | 0.238 | 0.000 | ||
| 1 spectrum, GGFSETR | 0.000 | 0.000 | 0.173 | 0.058 | 0.015 | 0.390 | 0.364 | 0.000 | ||
| 1 spectrum, IMELHK | 0.000 | 0.184 | 0.000 | 0.000 | 0.000 | 0.758 | 0.059 | 0.000 | ||
| 2 spectra, ADIITGR | 0.000 | 0.000 | 0.097 | 0.177 | 0.000 | 0.670 | 0.056 | 0.000 | ||
| 2 spectra, DYCEADGLSER | 0.000 | 0.000 | 0.078 | 0.197 | 0.000 | 0.591 | 0.134 | 0.000 | ||
| 2 spectra, GFLVMGSK | 0.031 | 0.000 | 0.072 | 0.314 | 0.000 | 0.373 | 0.210 | 0.000 | ||
| 1 spectrum, VKPPRPR | 0.000 | 0.000 | 0.090 | 0.069 | 0.000 | 0.612 | 0.230 | 0.000 | ||
| 1 spectrum, LVSPEPPPK | 0.150 | 0.000 | 0.343 | 0.000 | 0.268 | 0.077 | 0.163 | 0.000 | ||
| 1 spectrum, DNHLAIER | 0.000 | 0.062 | 0.000 | 0.074 | 0.000 | 0.310 | 0.553 | 0.000 | ||
| 2 spectra, QASALIDRPAPFFER | 0.000 | 0.000 | 0.050 | 0.200 | 0.000 | 0.730 | 0.021 | 0.000 |
| Plot | Mito | Lyso or Perox | ER | Golgi | PM | Cytosol | Nucleus | ||||||
| Expt B |
1 peptide |
1 spectrum |
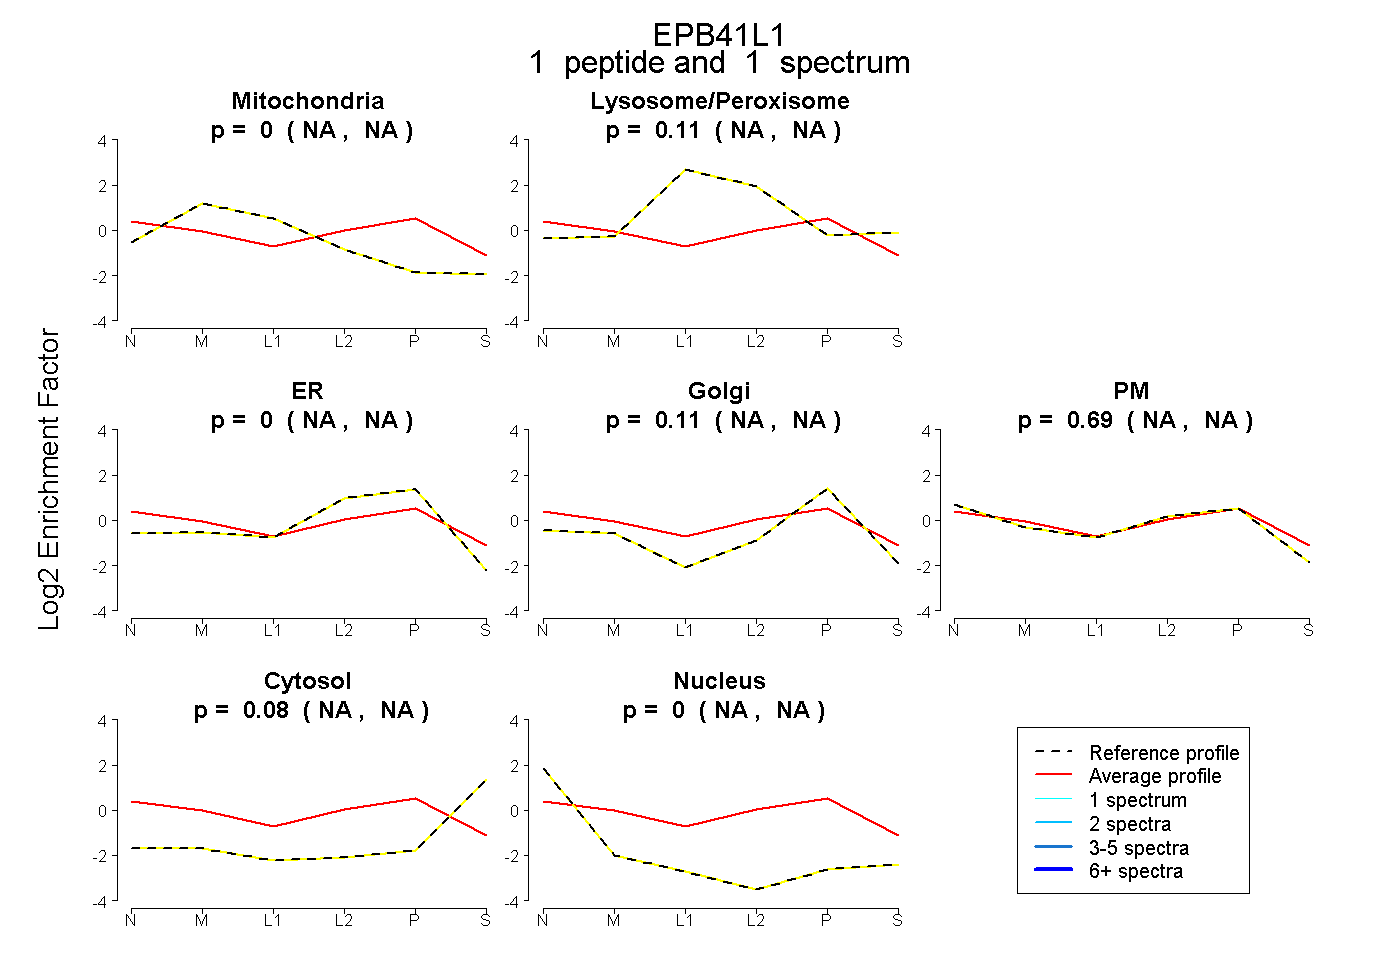 |
0.000 NA | NA |
0.114 NA | NA |
0.000 NA | NA |
0.112 NA | NA |
0.695 NA | NA |
0.079 NA | NA |
0.000 NA | NA |
|||
| Plot | Lyso | Other | |||||||||||
| Expt C |
9 peptides |
28 spectra |
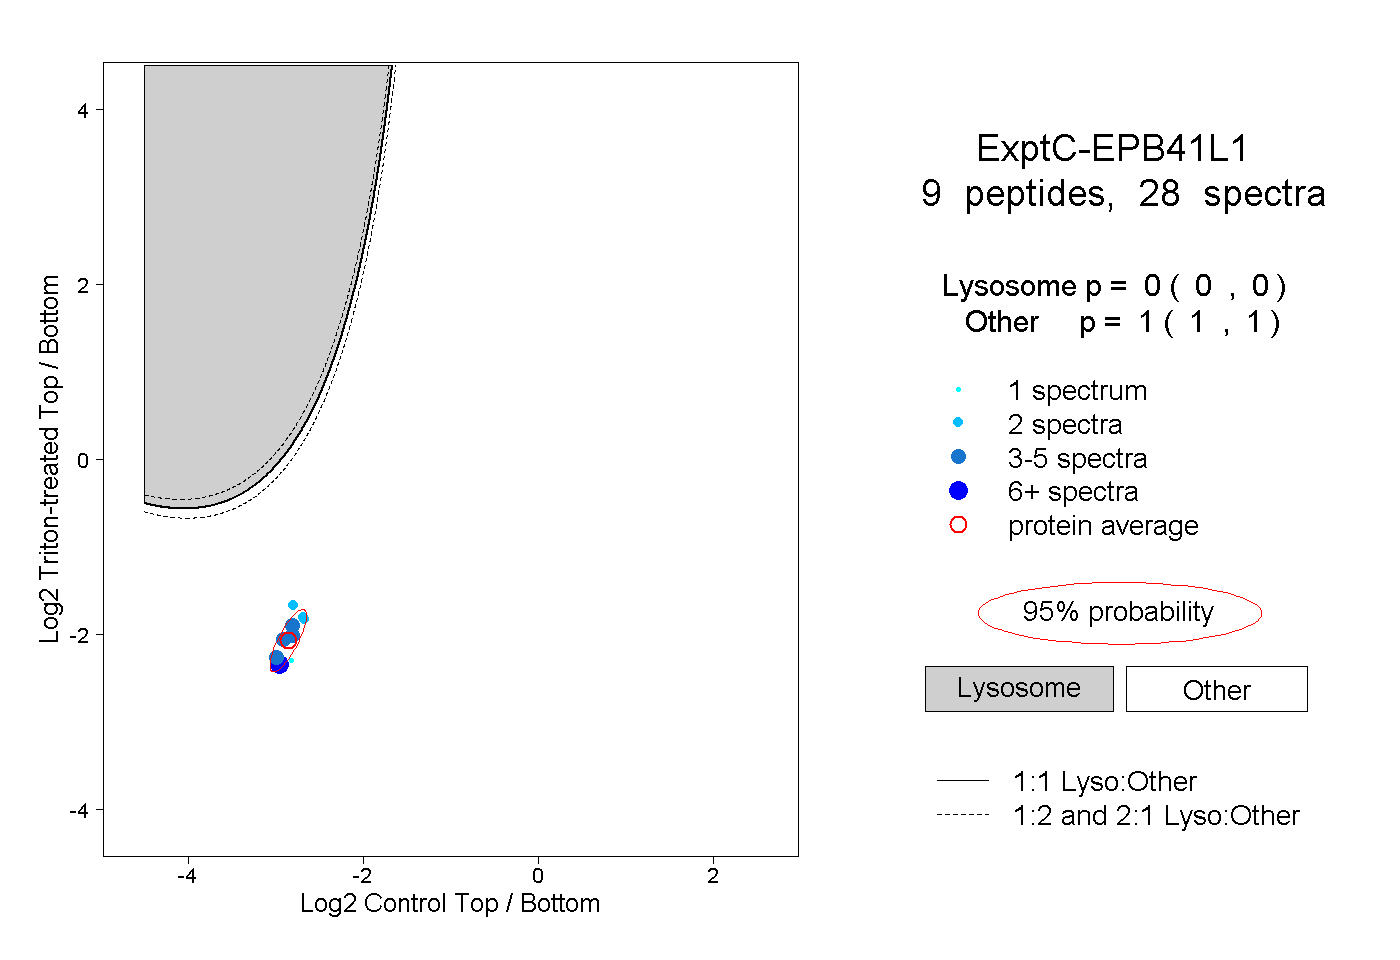 |
0.000 0.000 | 0.000 |
1.000 1.000 | 1.000 |