 12
12peptides
spectra
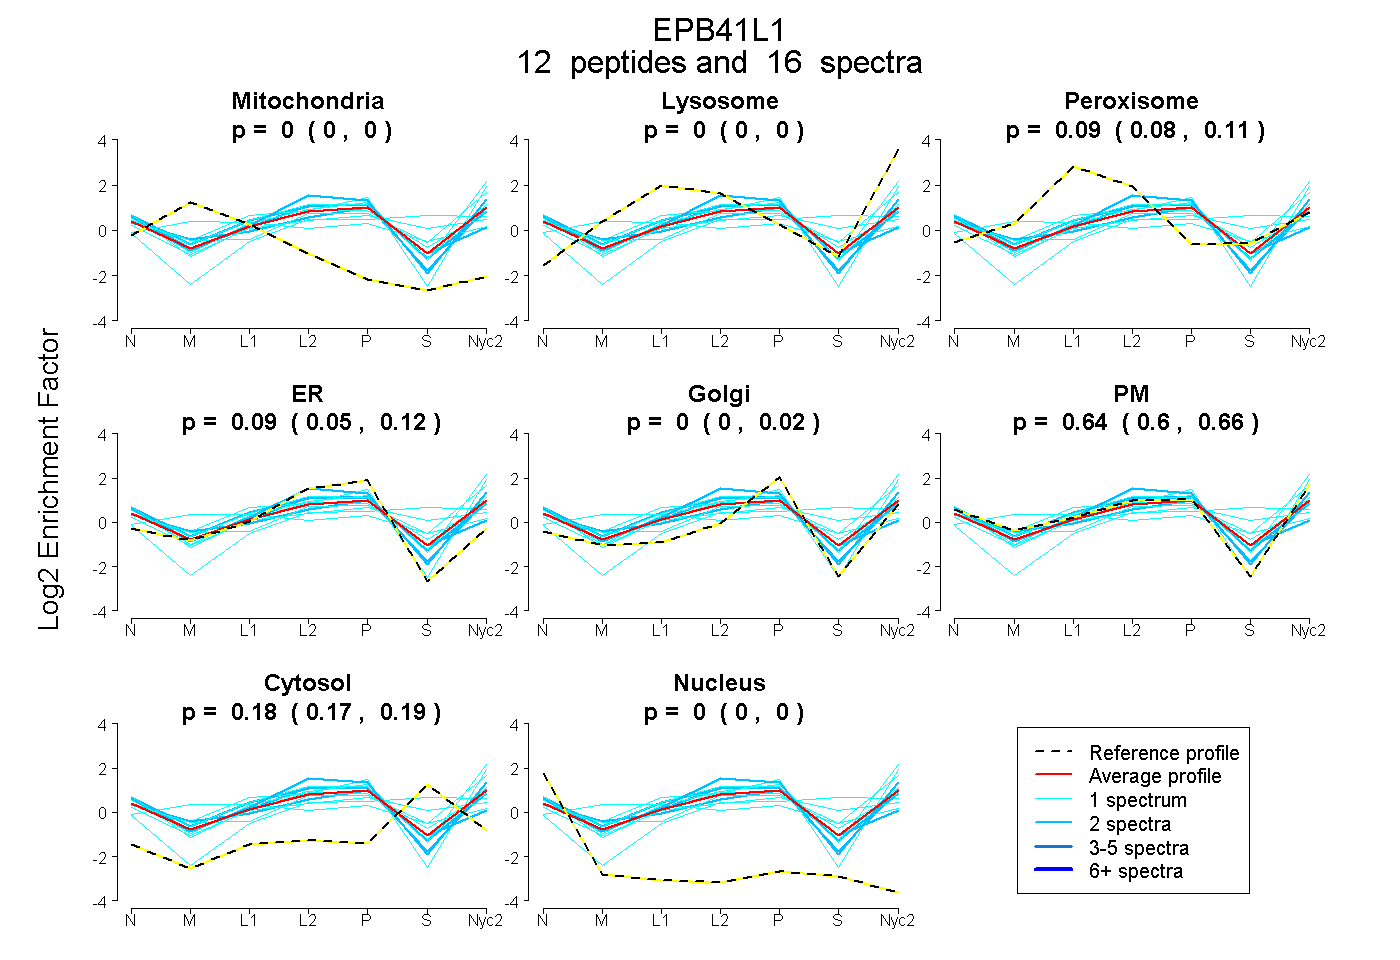
0.000 | 0.000
0.000 | 0.000
0.076 | 0.109
0.047 | 0.115
0.000 | 0.021
0.598 | 0.665
0.169 | 0.193
0.000 | 0.000
1peptide
spectrum
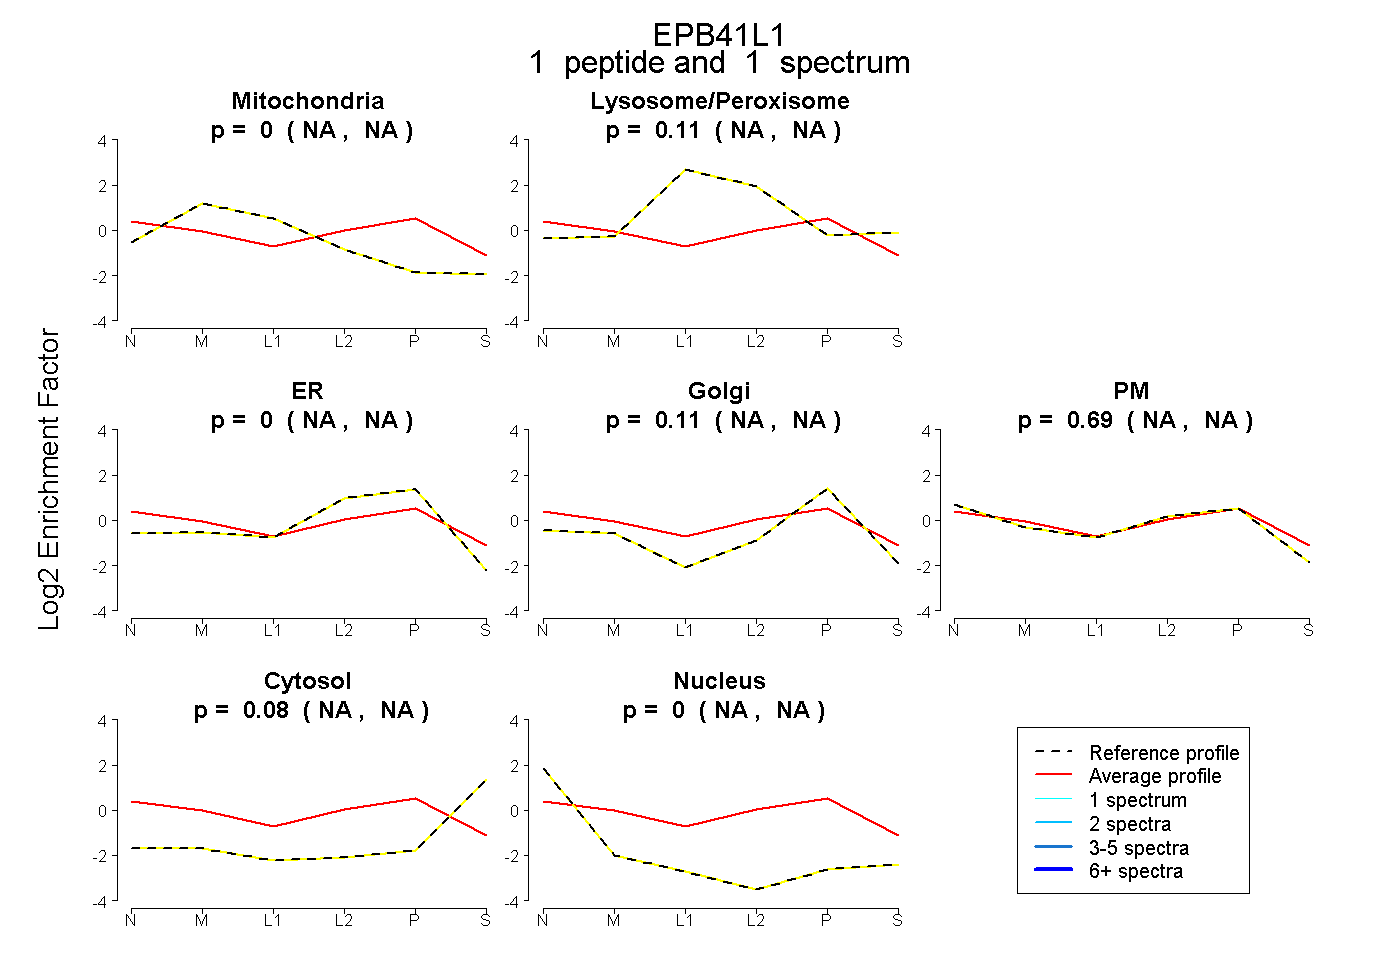
NA | NA
NA | NA
NA | NA
NA | NA
NA | NA
NA | NA
NA | NA
| Plot | Mito | Lyso | Perox | ER | Golgi | PM | Cytosol | Nucleus | |||||
| Expt A |
12 peptides |
16 spectra |
|
0.000 0.000 | 0.000 |
0.000 0.000 | 0.000 |
0.093 0.076 | 0.109 |
0.086 0.047 | 0.115 |
0.000 0.000 | 0.021 |
0.638 0.598 | 0.665 |
0.183 0.169 | 0.193 |
0.000 0.000 | 0.000 |
||
| Plot | Mito | Lyso or Perox | ER | Golgi | PM | Cytosol | Nucleus | ||||||
| Expt B |
1 peptide |
1 spectrum |
|
0.000 NA | NA |
0.114 NA | NA |
0.000 NA | NA |
0.112 NA | NA |
0.695 NA | NA |
0.079 NA | NA |
0.000 NA | NA |
| 1 spectrum, FAPNQTR | 0.000 | 0.114 | 0.000 | 0.112 | 0.695 | 0.079 | 0.000 |
| Plot | Lyso | Other | |||||||||||
| Expt C |
9 peptides |
28 spectra |
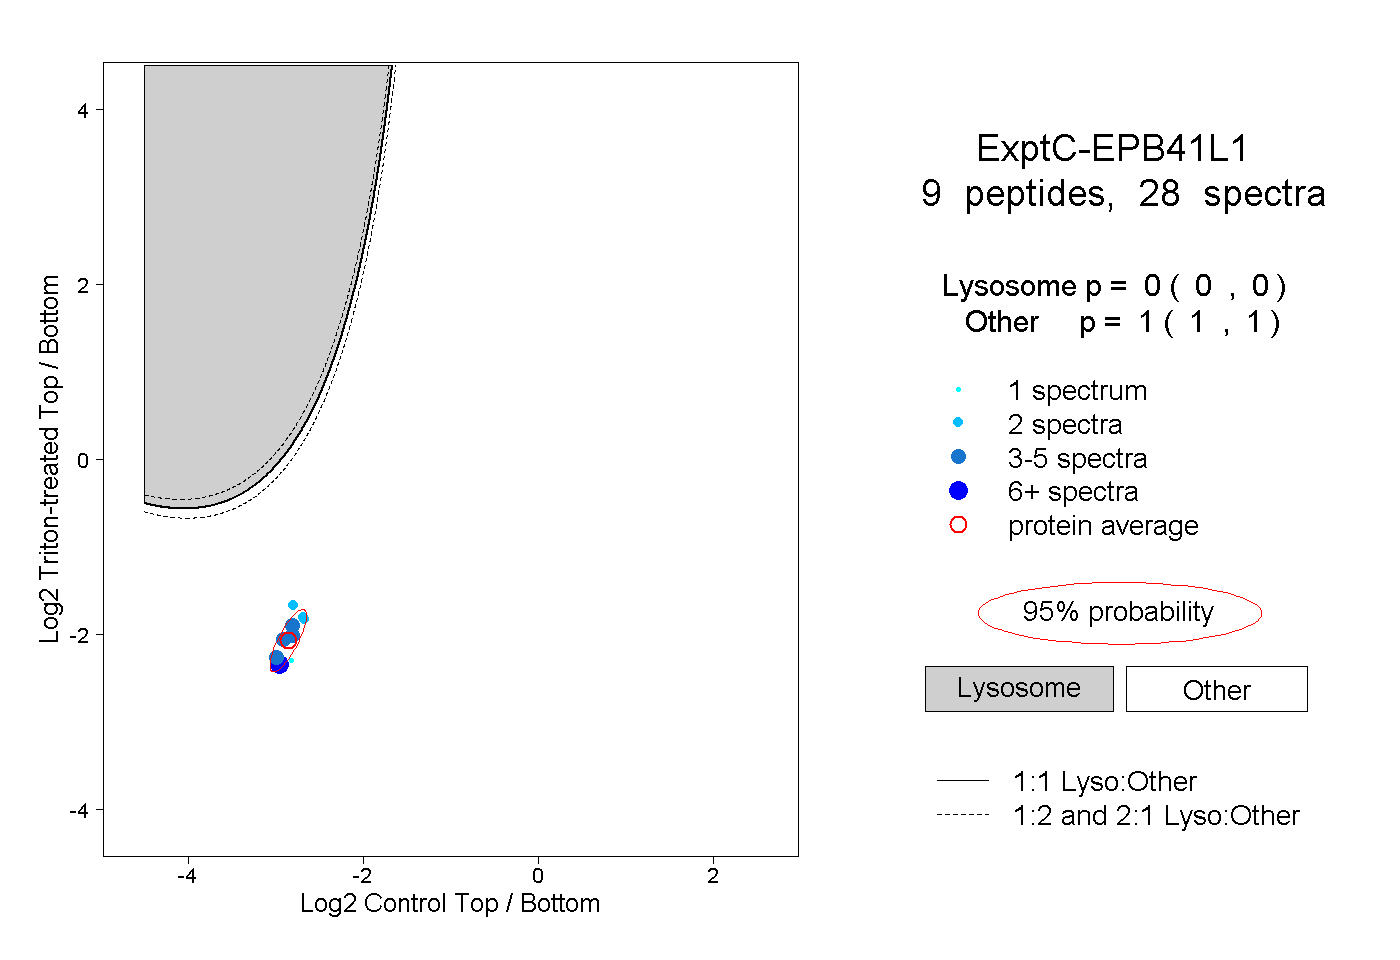 |
0.000 0.000 | 0.000 |
1.000 1.000 | 1.000 |