 11
11peptides
spectra
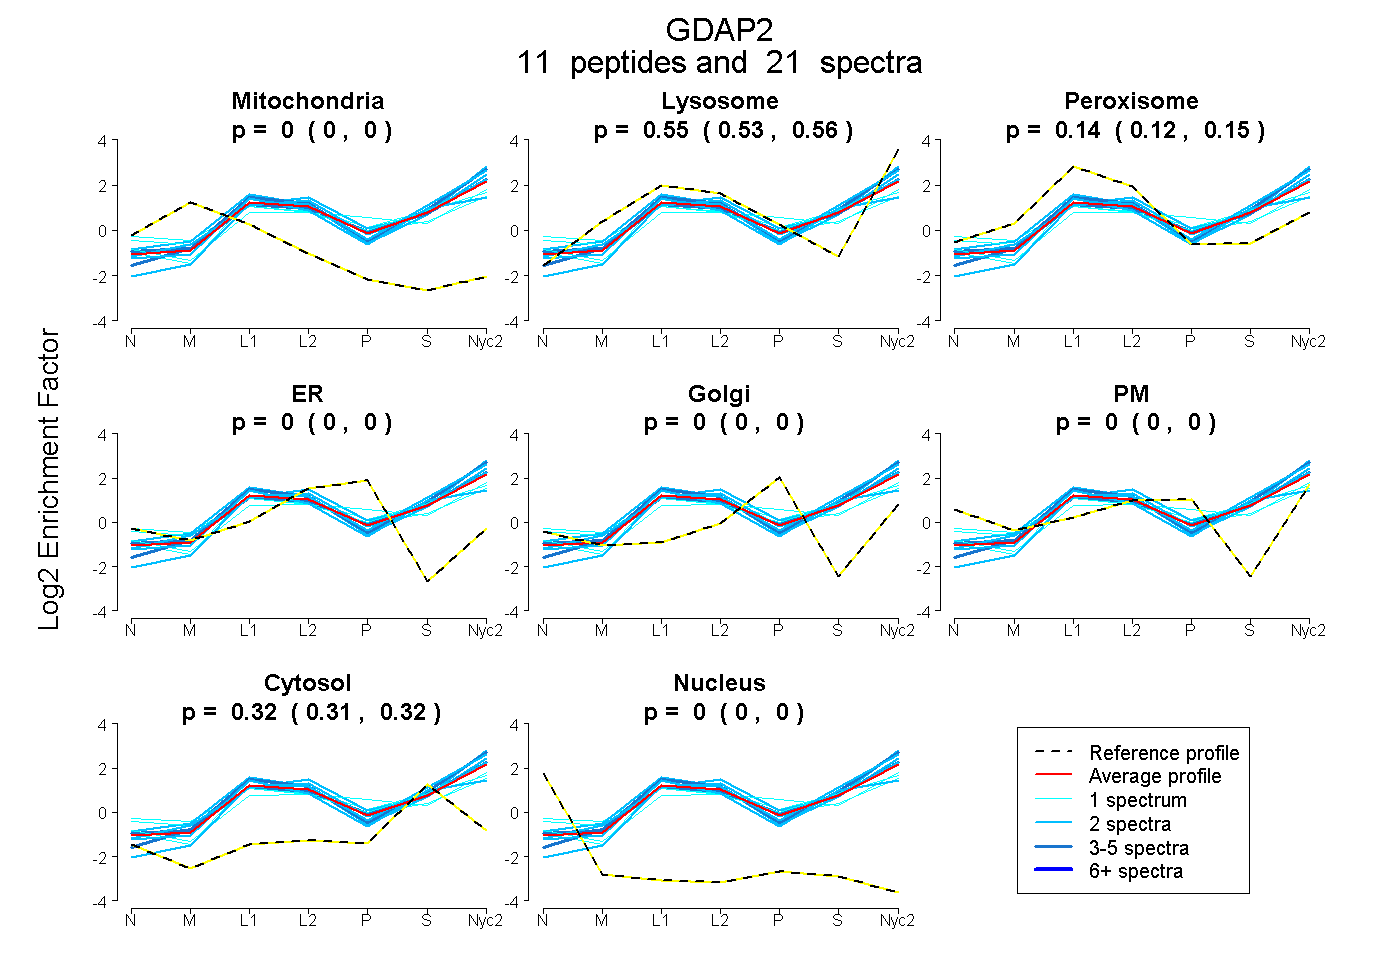
0.000 | 0.000
0.527 | 0.560
0.118 | 0.152
0.000 | 0.000
0.000 | 0.000
0.000 | 0.000
0.313 | 0.323
0.000 | 0.000
4peptides
spectra
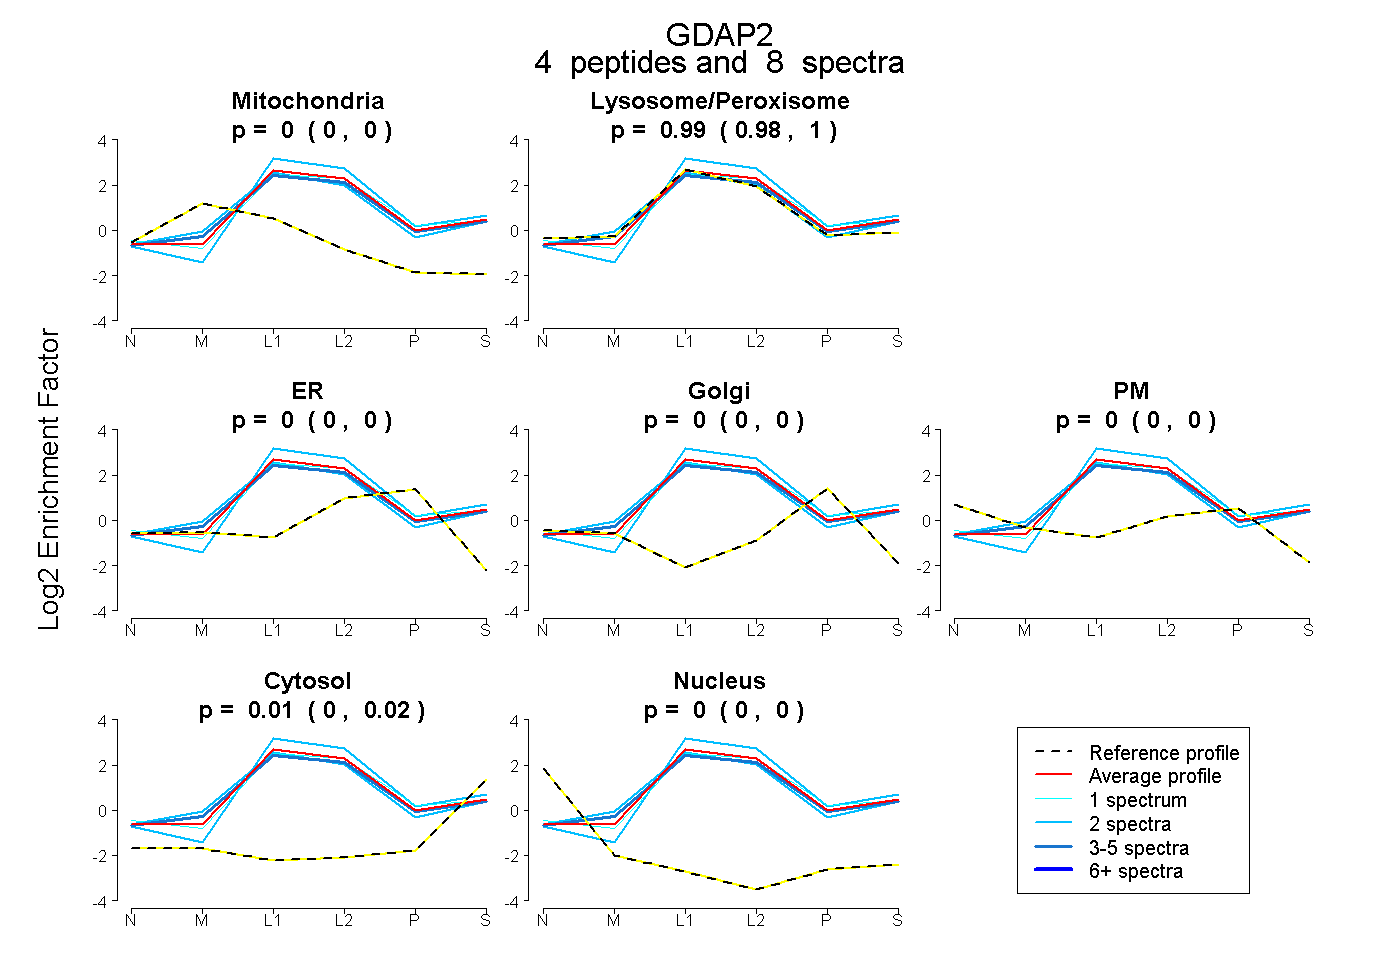
0.000 | 0.000
0.977 | 1.000
0.000 | 0.000
0.000 | 0.000
0.000 | 0.000
0.000 | 0.020
0.000 | 0.000
15peptides
spectra
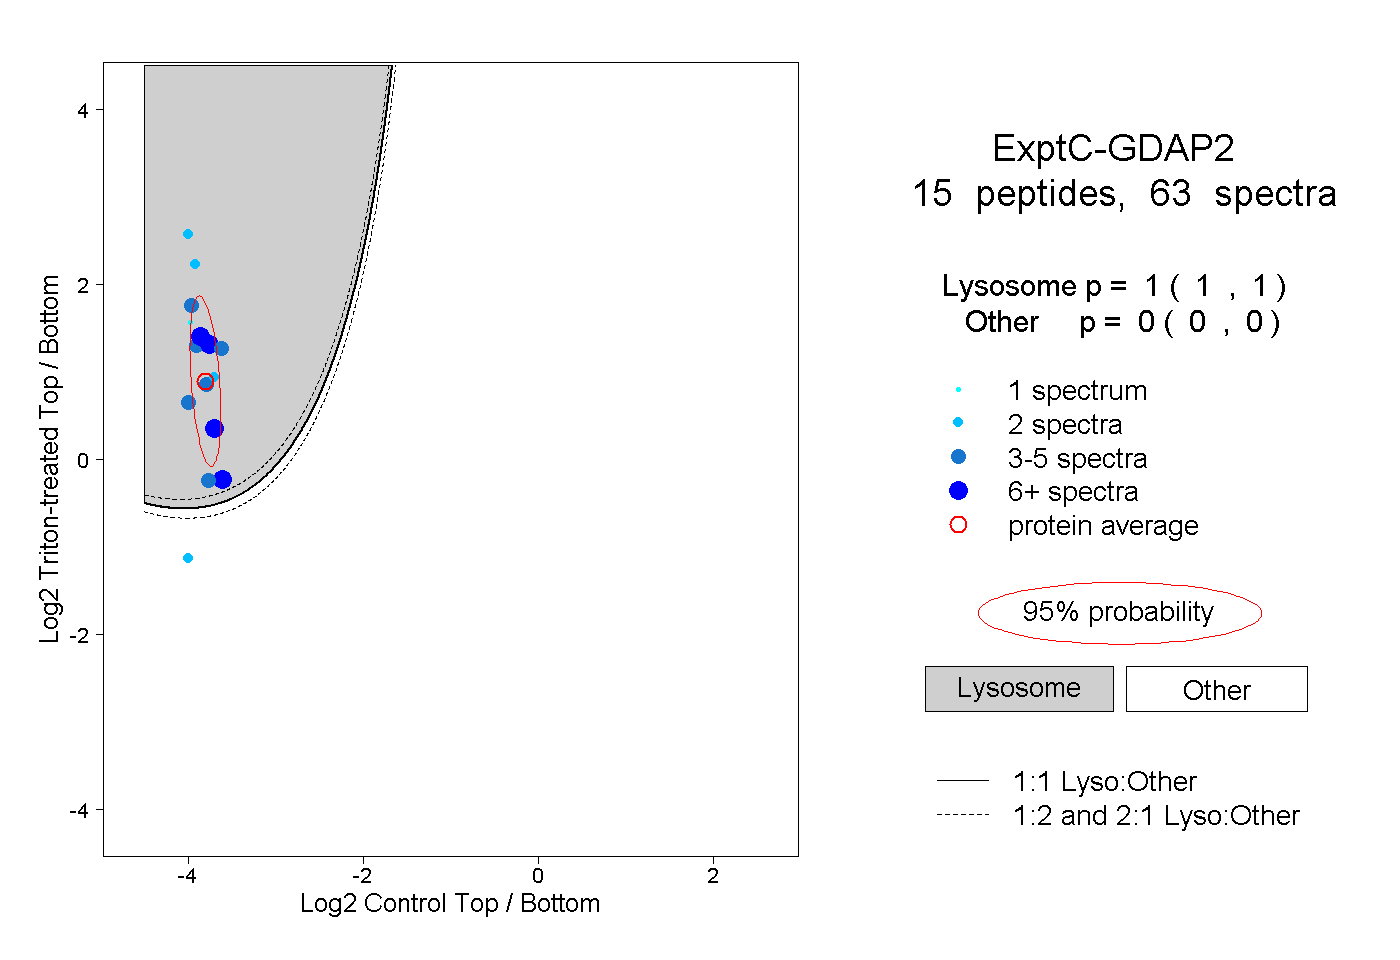
1.000 | 1.000
0.000 | 0.000
2peptides
spectra
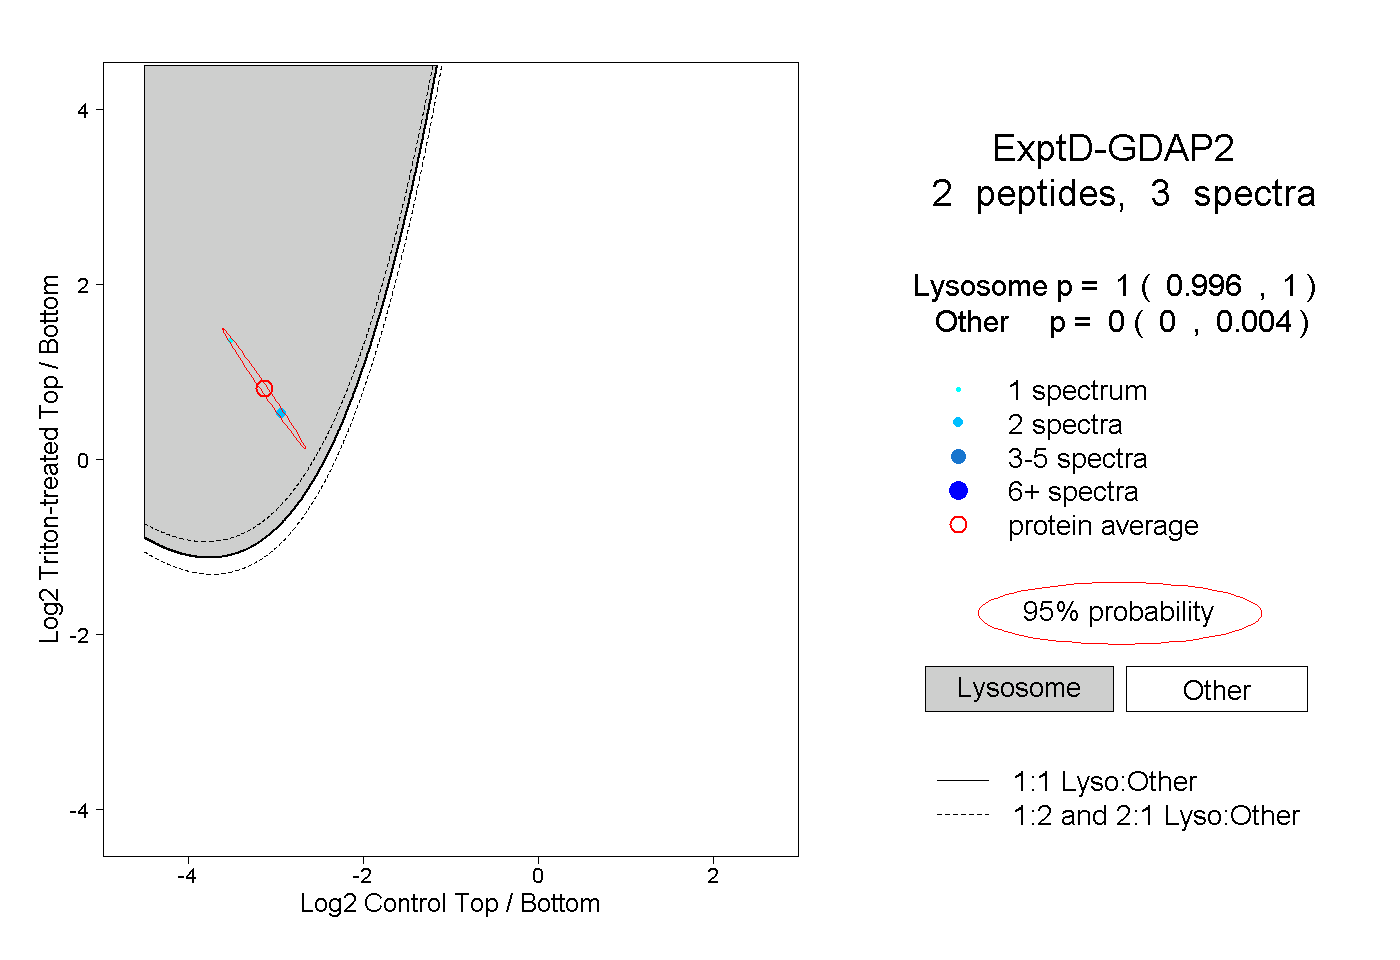
0.996 | 1.000
0.000 | 0.004