GDAP2
[ENSRNOP00000026953]
Main page
| | | Plot |
Mito |
Lyso |
|
Perox |
ER |
Golgi |
PM |
Cytosol |
Nucleus |
|
| Expt A |
 11
11
peptides |
21
spectra |
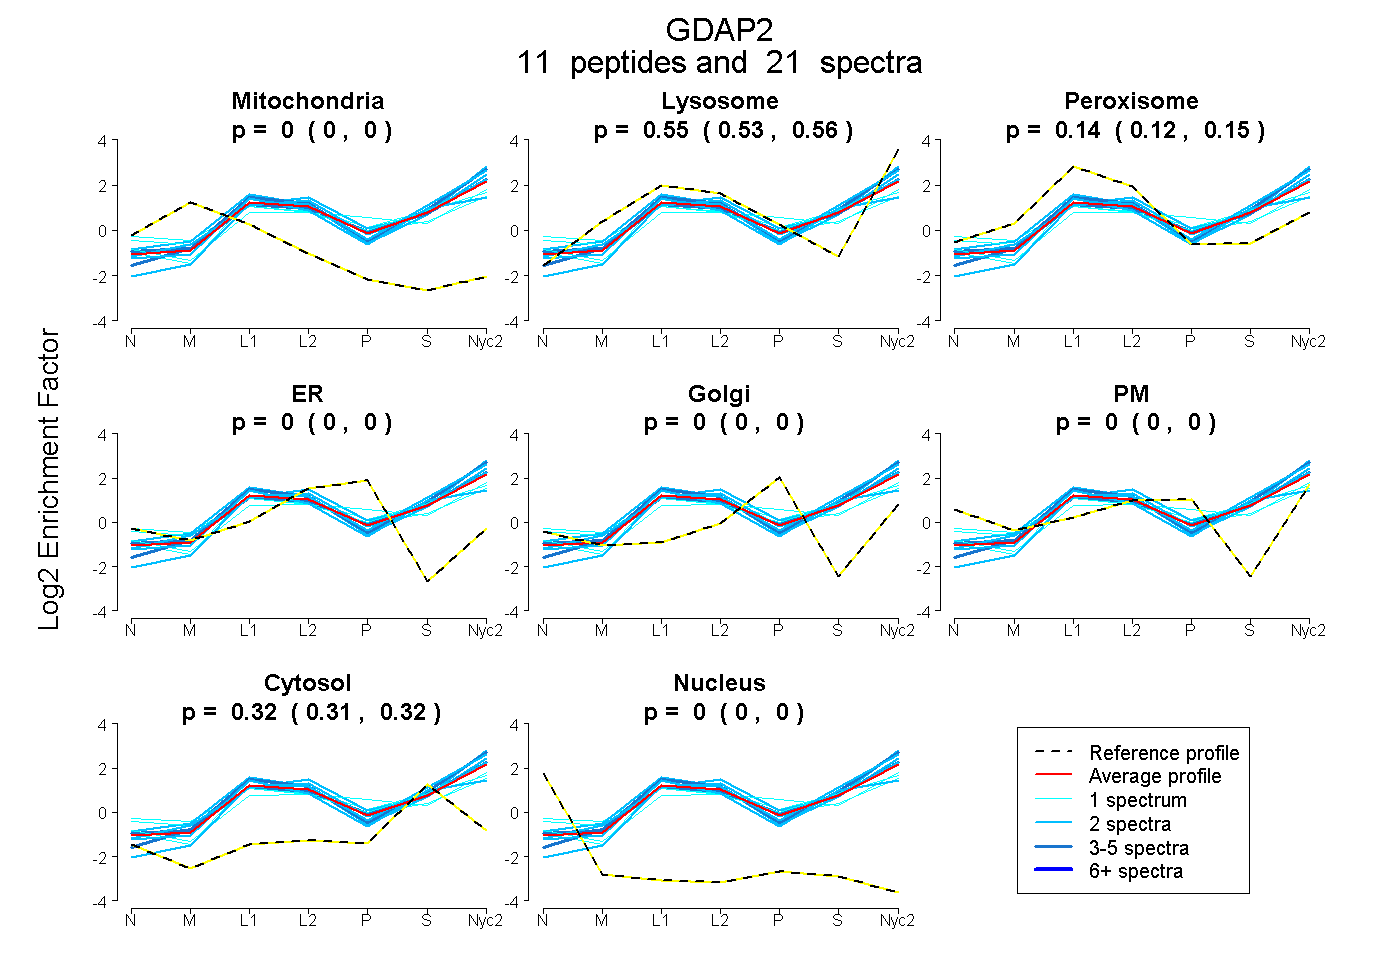 |
0.000
0.000 | 0.000 |
0.545
0.527 | 0.560 |
|
0.136
0.118 | 0.152 |
0.000
0.000 | 0.000 |
0.000
0.000 | 0.000 |
0.000
0.000 | 0.000 |
0.318
0.313 | 0.323 |
0.000
0.000 | 0.000 |
|
| | | Plot |
Mito |
|
Lyso or Perox |
|
ER |
Golgi |
PM |
Cytosol |
Nucleus |
|
| Expt B |
4
peptides |
8
spectra |
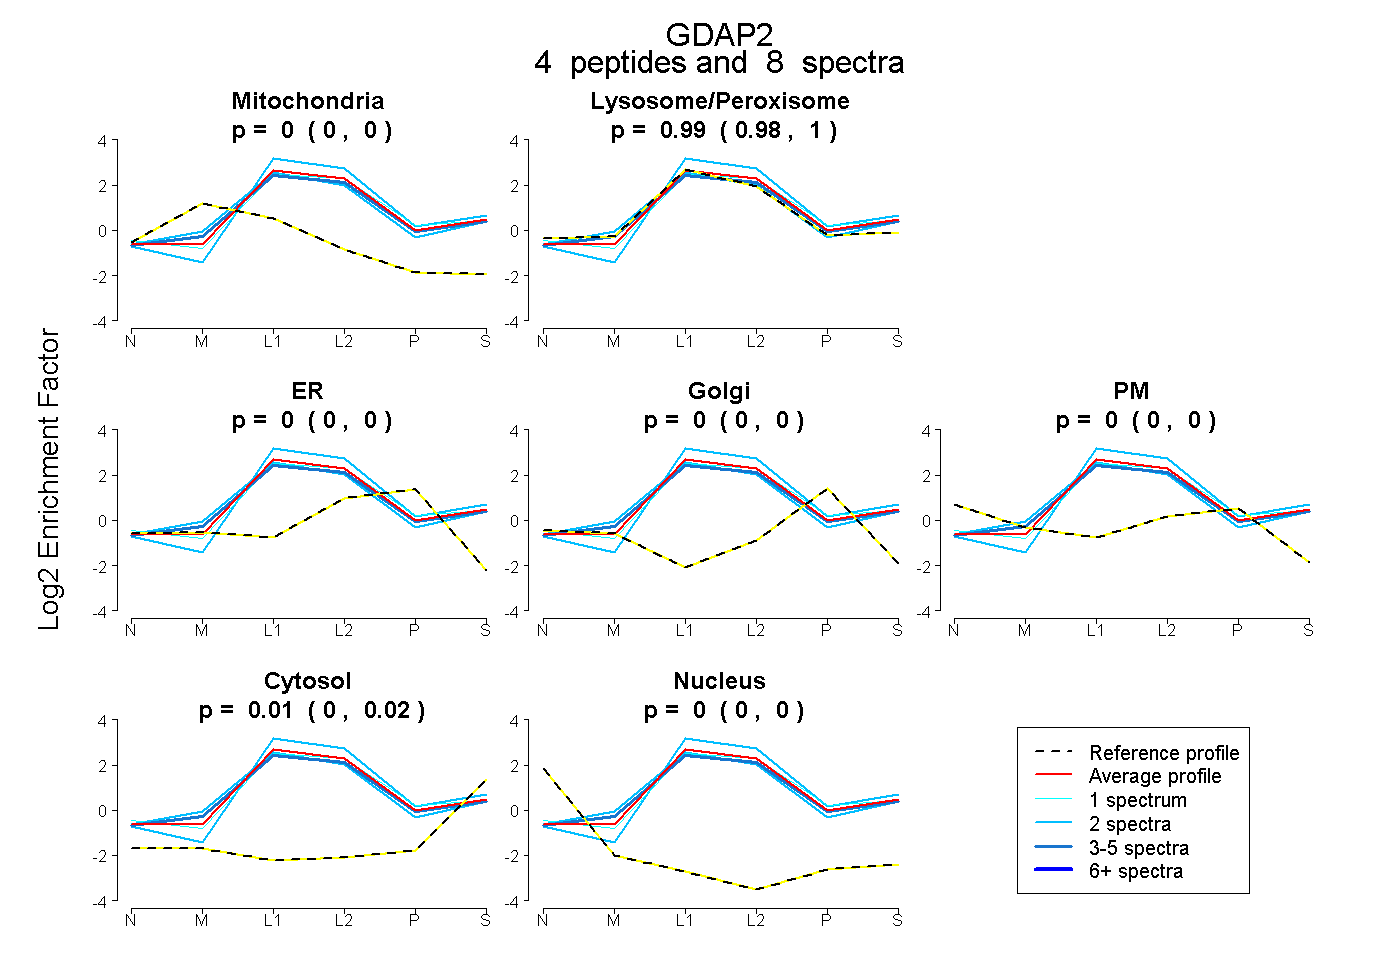 |
0.000
0.000 | 0.000 |
|
0.994
0.977 | 1.000 |
|
0.000
0.000 | 0.000 |
0.000
0.000 | 0.000 |
0.000
0.000 | 0.000 |
0.006
0.000 | 0.020 |
0.000
0.000 | 0.000 |
|
| 2 spectra, LLPLYFPR |
0.000 |
|
1.000 |
|
0.000 |
0.000 |
0.000 |
0.000 |
0.000 |
|
| 1 spectrum, LYDVVDIK |
0.000 |
|
0.987 |
|
0.000 |
0.000 |
0.000 |
0.013 |
0.000 |
|
| 3 spectra, TVMVVVGR |
0.000 |
|
0.966 |
|
0.000 |
0.000 |
0.000 |
0.034 |
0.000 |
|
| 2 spectra, GFNLAAR |
0.000 |
|
0.972 |
|
0.000 |
0.000 |
0.000 |
0.028 |
0.000 |
|
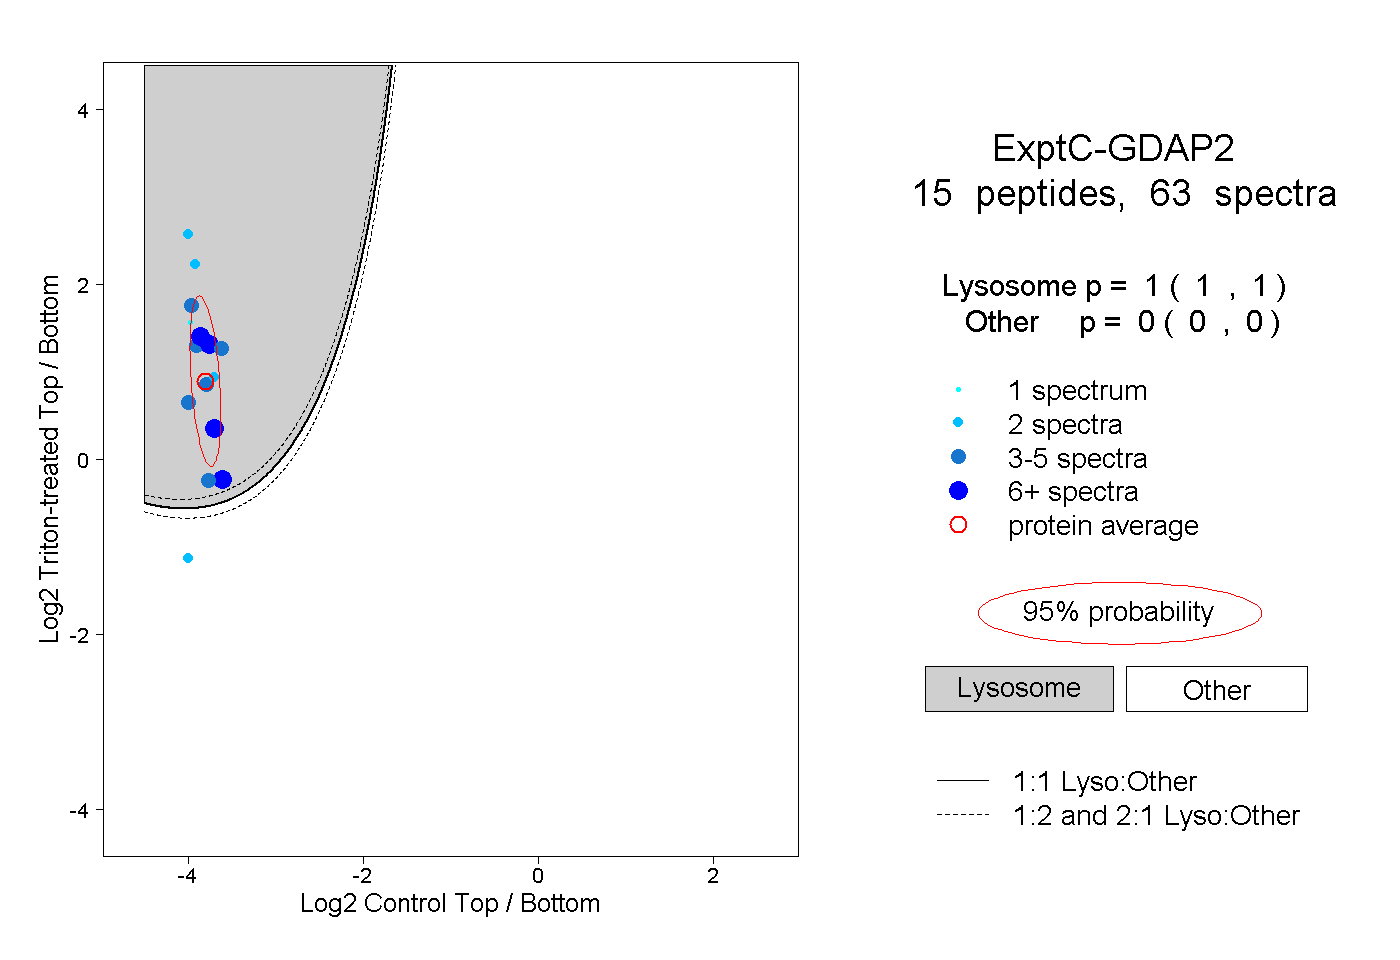
| | | Plot |
|
Lyso |
|
|
|
|
|
|
|
Other |
| Expt C |
15
peptides |
63
spectra |
 |
|
1.000
1.000 | 1.000 |
|
|
|
|
|
|
|
0.000
0.000 | 0.000 |
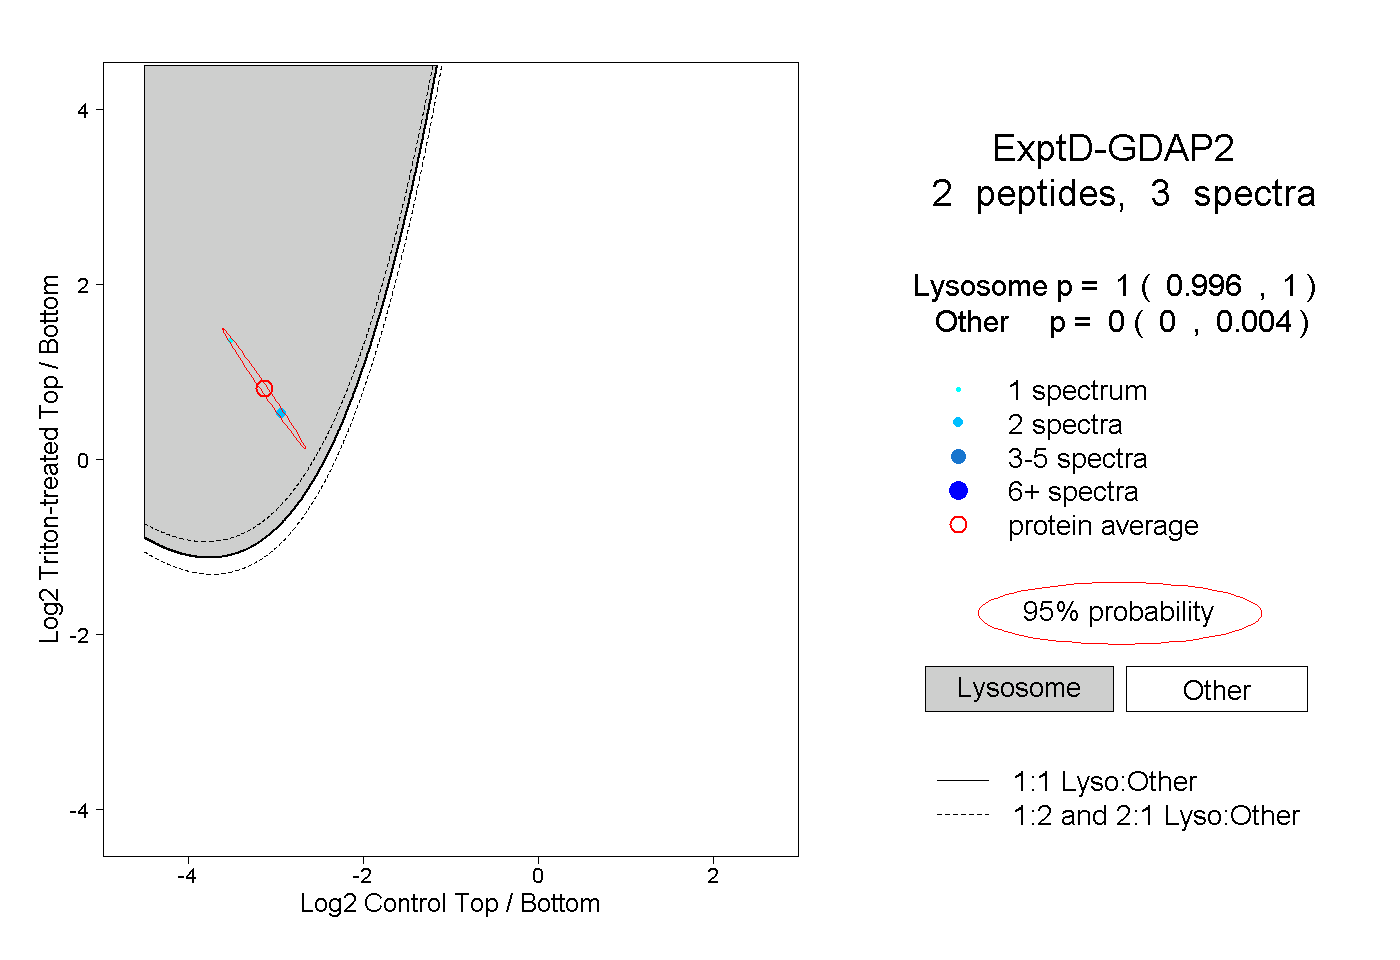
| | | Plot |
|
Lyso |
|
|
|
|
|
|
|
Other |
| Expt D |
2
peptides |
3
spectra |
 |
|
1.000
0.996 | 1.000 |
|
|
|
|
|
|
|
0.000
0.000 | 0.004 |