 11
11peptides
spectra
0.000 | 0.000
0.527 | 0.560
0.118 | 0.152
0.000 | 0.000
0.000 | 0.000
0.000 | 0.000
0.313 | 0.323
0.000 | 0.000
| Plot | Mito | Lyso | Perox | ER | Golgi | PM | Cytosol | Nucleus | |||||
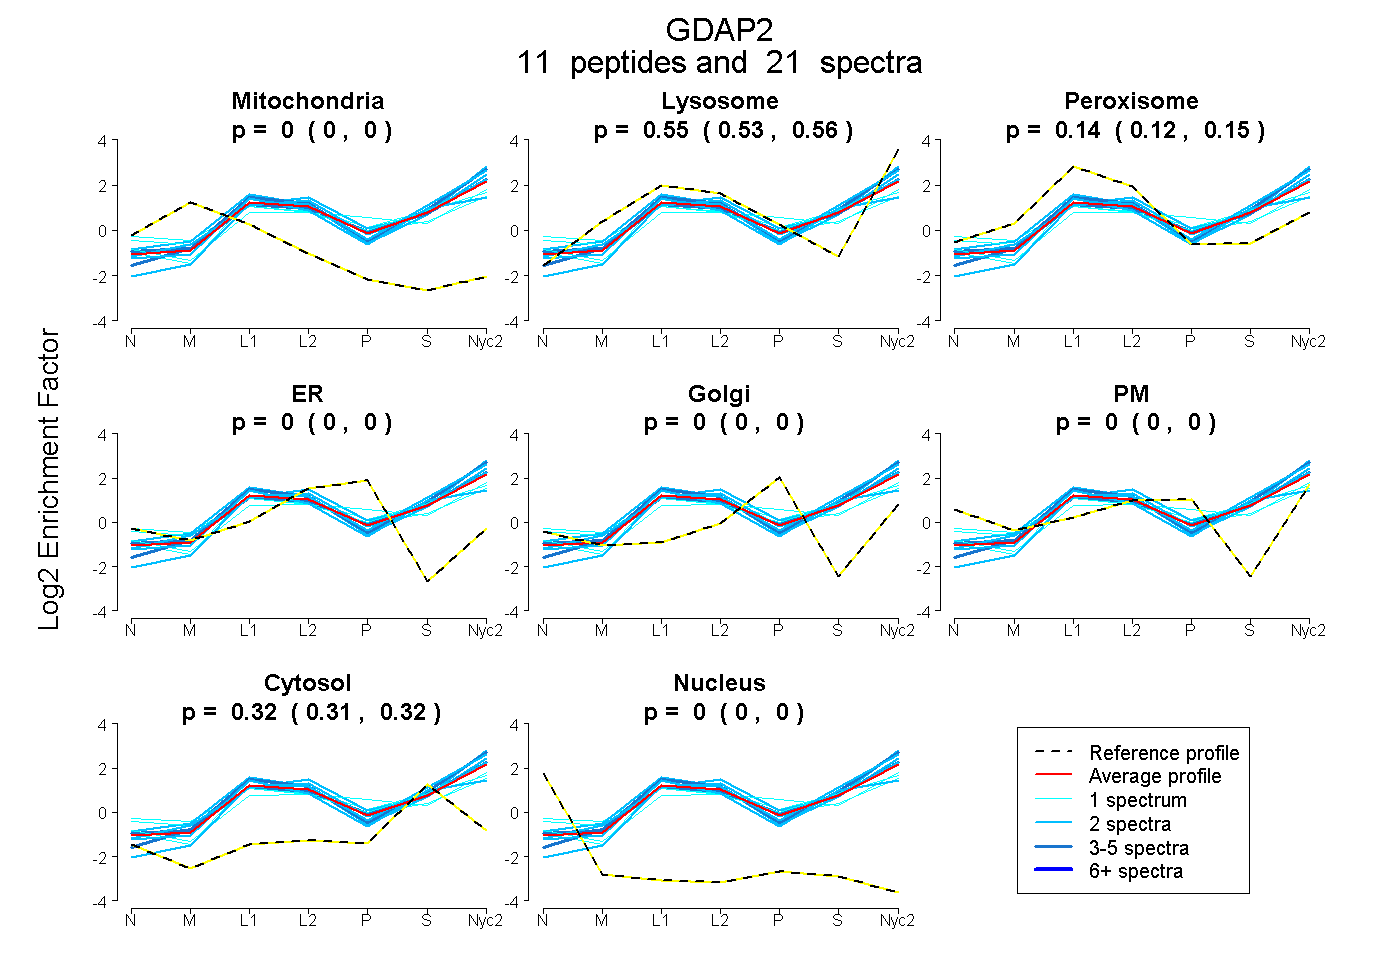
| Expt A |
11 peptides |
21 spectra |
|
0.000 0.000 | 0.000 |
0.545 0.527 | 0.560 |
0.136 0.118 | 0.152 |
0.000 0.000 | 0.000 |
0.000 0.000 | 0.000 |
0.000 0.000 | 0.000 |
0.318 0.313 | 0.323 |
0.000 0.000 | 0.000 |
| 1 spectrum, ALYQTGVDNCGR | 0.000 | 0.418 | 0.227 | 0.000 | 0.000 | 0.000 | 0.355 | 0.000 | ||
| 2 spectra, FIIHTVGPK | 0.000 | 0.633 | 0.090 | 0.000 | 0.000 | 0.000 | 0.277 | 0.000 | ||
| 1 spectrum, SEDLSDIASLK | 0.000 | 0.592 | 0.004 | 0.000 | 0.000 | 0.000 | 0.404 | 0.000 | ||
| 1 spectrum, AVYFVHPTFR | 0.000 | 0.287 | 0.323 | 0.000 | 0.000 | 0.107 | 0.283 | 0.000 | ||
| 2 spectra, WLCQAR | 0.000 | 0.579 | 0.130 | 0.000 | 0.000 | 0.000 | 0.292 | 0.000 | ||
| 2 spectra, TVMVVVGR | 0.000 | 0.644 | 0.000 | 0.000 | 0.000 | 0.000 | 0.356 | 0.000 | ||
| 2 spectra, TAAESSLYSCYR | 0.000 | 0.317 | 0.319 | 0.000 | 0.000 | 0.000 | 0.364 | 0.000 | ||
| 1 spectrum, GYPLEDATHIALR | 0.000 | 0.401 | 0.170 | 0.000 | 0.000 | 0.167 | 0.262 | 0.000 | ||
| 4 spectra, LLPLYFPR | 0.000 | 0.678 | 0.037 | 0.000 | 0.000 | 0.000 | 0.285 | 0.000 | ||
| 2 spectra, FLEIHGETIEK | 0.000 | 0.628 | 0.143 | 0.000 | 0.000 | 0.000 | 0.228 | 0.000 | ||
| 3 spectra, GFNLAAR | 0.000 | 0.572 | 0.107 | 0.000 | 0.000 | 0.000 | 0.321 | 0.000 |
| Plot | Mito | Lyso or Perox | ER | Golgi | PM | Cytosol | Nucleus | ||||||
| Expt B |
4 peptides |
8 spectra |
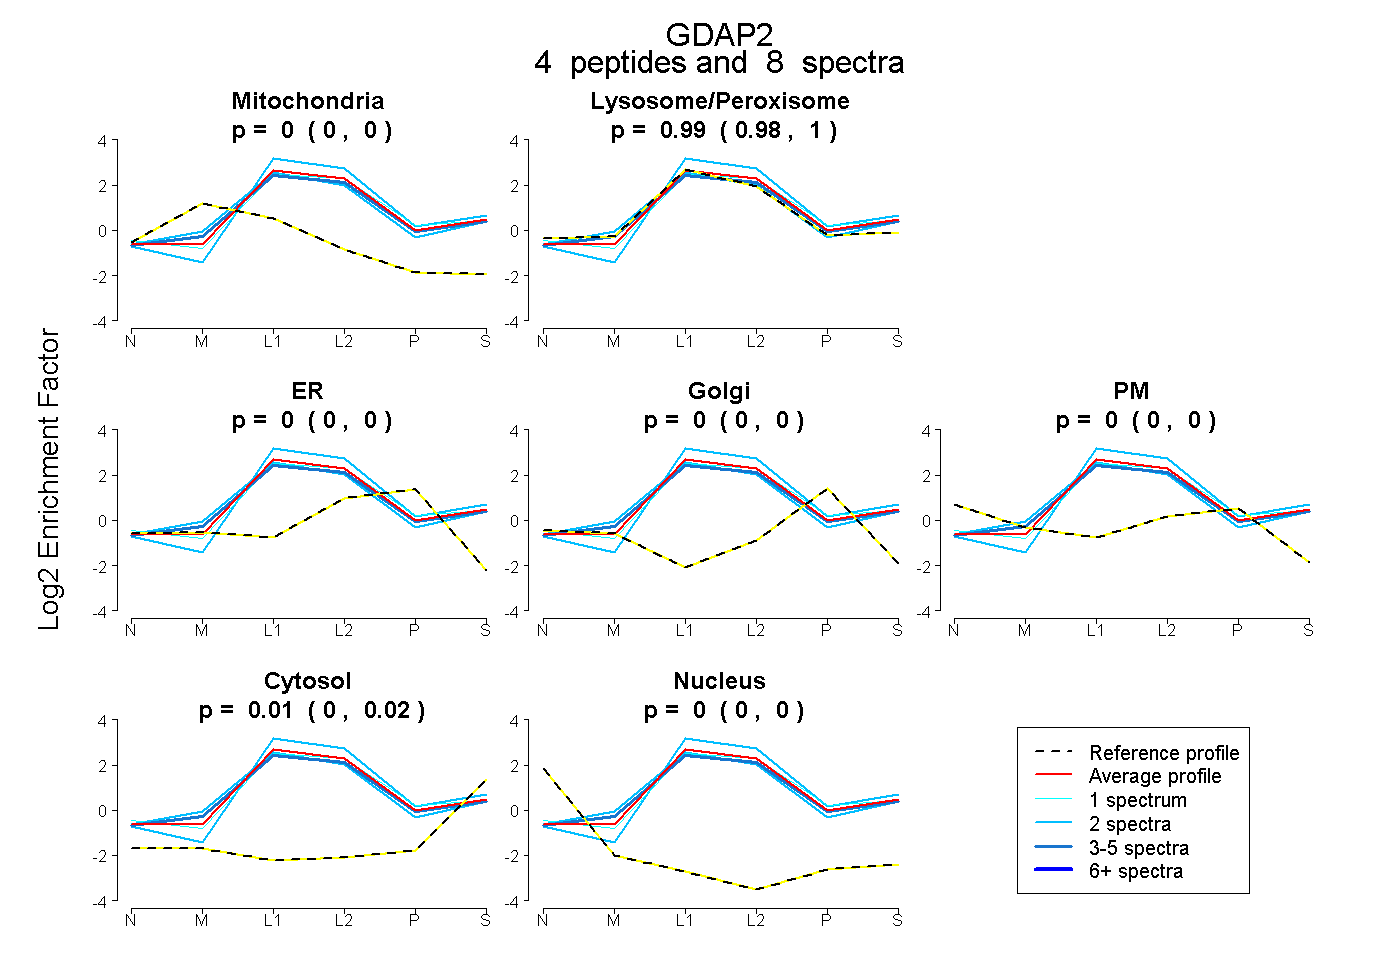 |
0.000 0.000 | 0.000 |
0.994 0.977 | 1.000 |
0.000 0.000 | 0.000 |
0.000 0.000 | 0.000 |
0.000 0.000 | 0.000 |
0.006 0.000 | 0.020 |
0.000 0.000 | 0.000 |
|||
| Plot | Lyso | Other | |||||||||||
| Expt C |
15 peptides |
63 spectra |
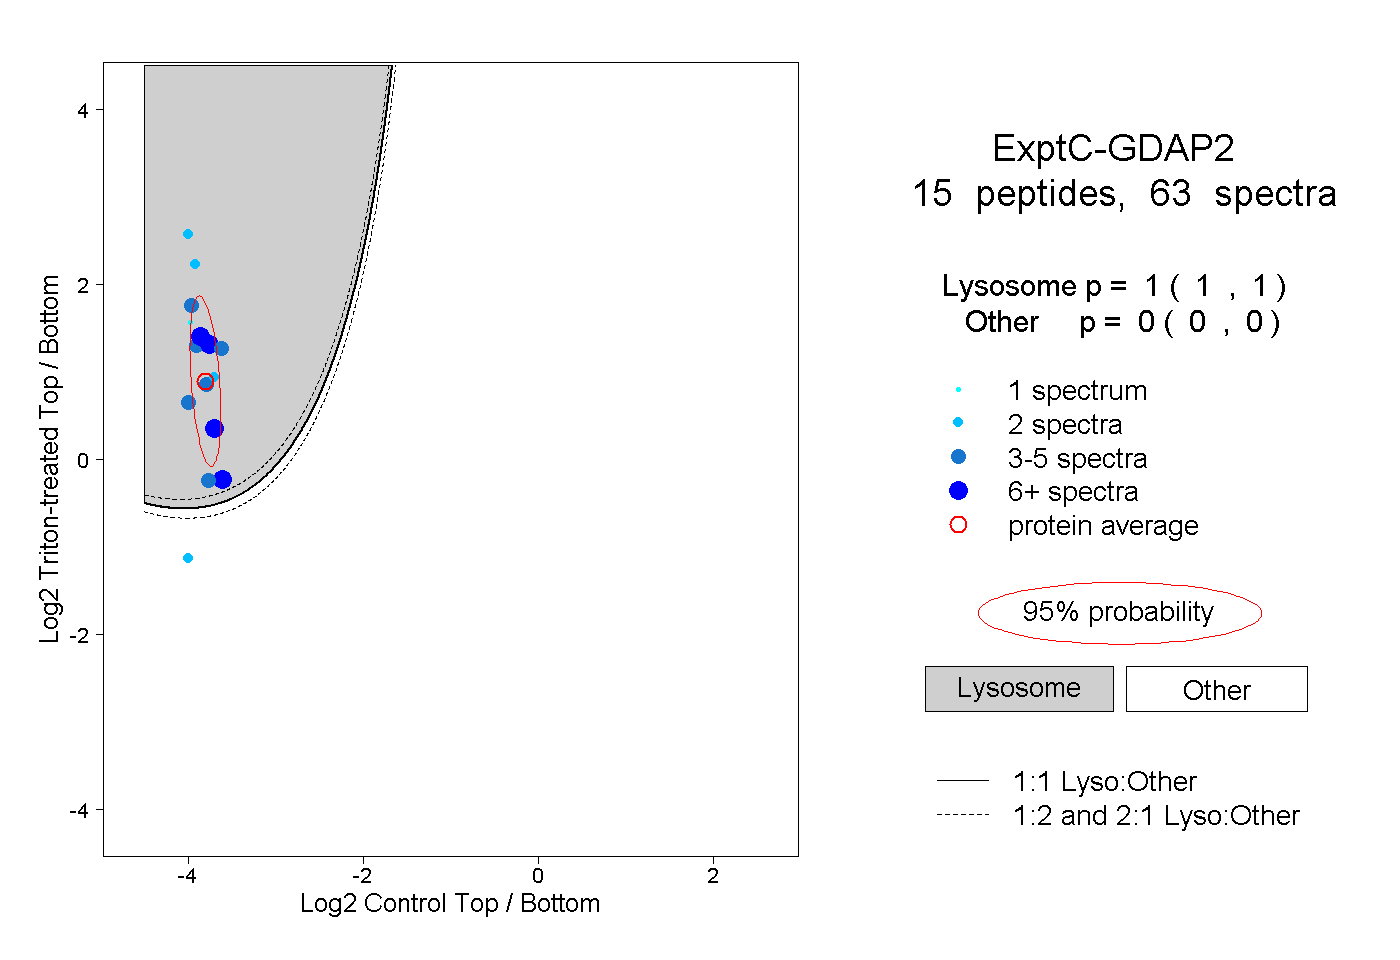 |
1.000 1.000 | 1.000 |
0.000 0.000 | 0.000 |
||||||||
| Plot | Lyso | Other | |||||||||||
| Expt D |
2 peptides |
3 spectra |
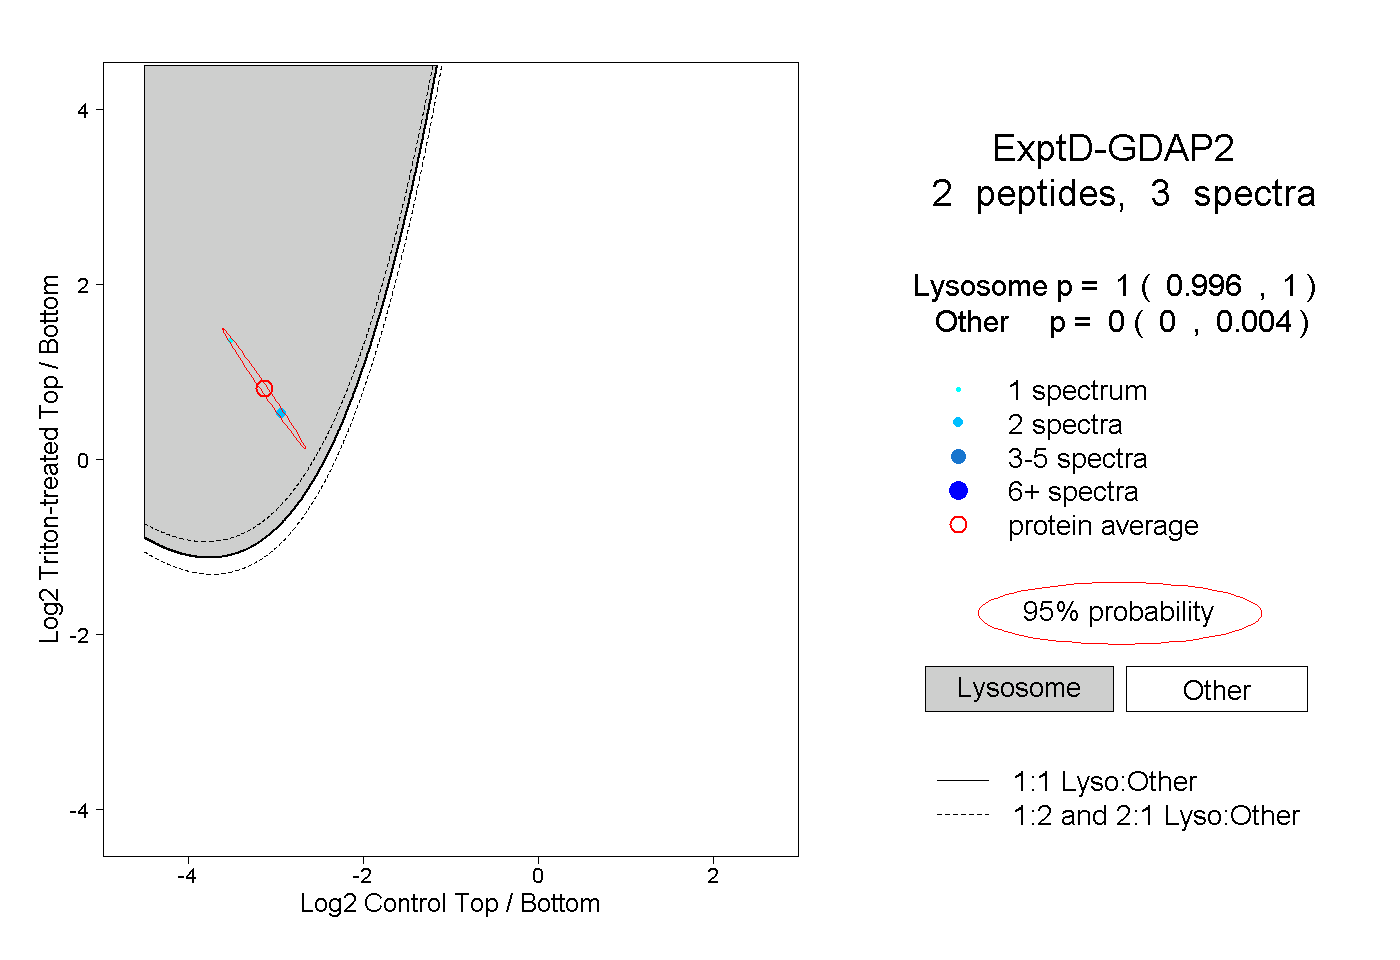 |
1.000 0.996 | 1.000 |
0.000 0.000 | 0.004 |