 15
15peptides
spectra
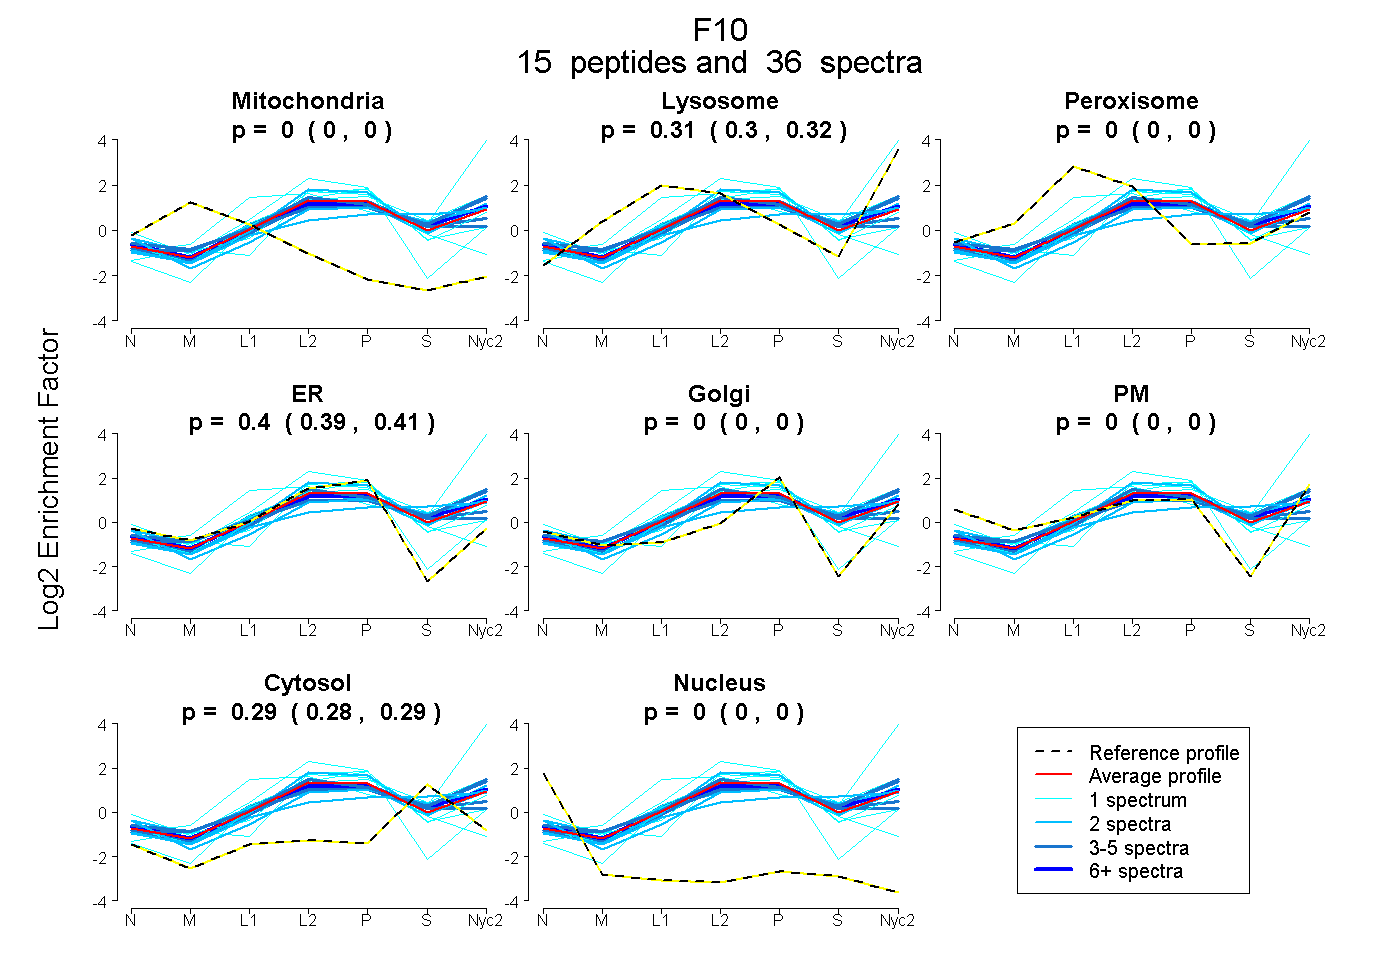
0.000 | 0.000
0.295 | 0.322
0.000 | 0.000
0.389 | 0.413
0.000 | 0.000
0.000 | 0.000
0.281 | 0.294
0.000 | 0.000
2peptides
spectra
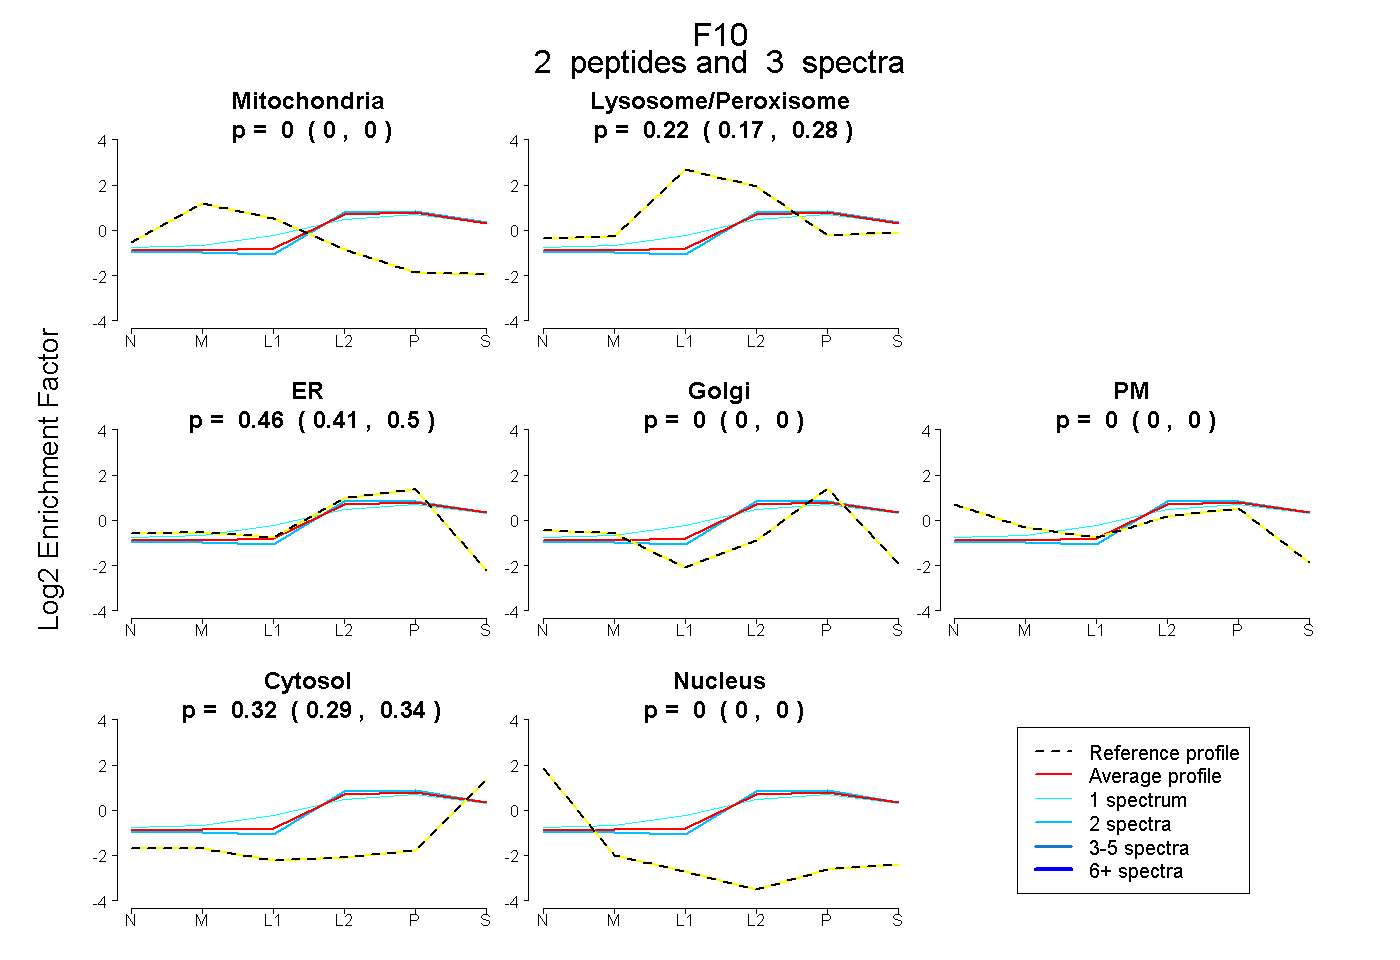
0.000 | 0.000
0.165 | 0.275
0.410 | 0.496
0.000 | 0.000
0.000 | 0.000
0.291 | 0.335
0.000 | 0.000
13peptides
spectra
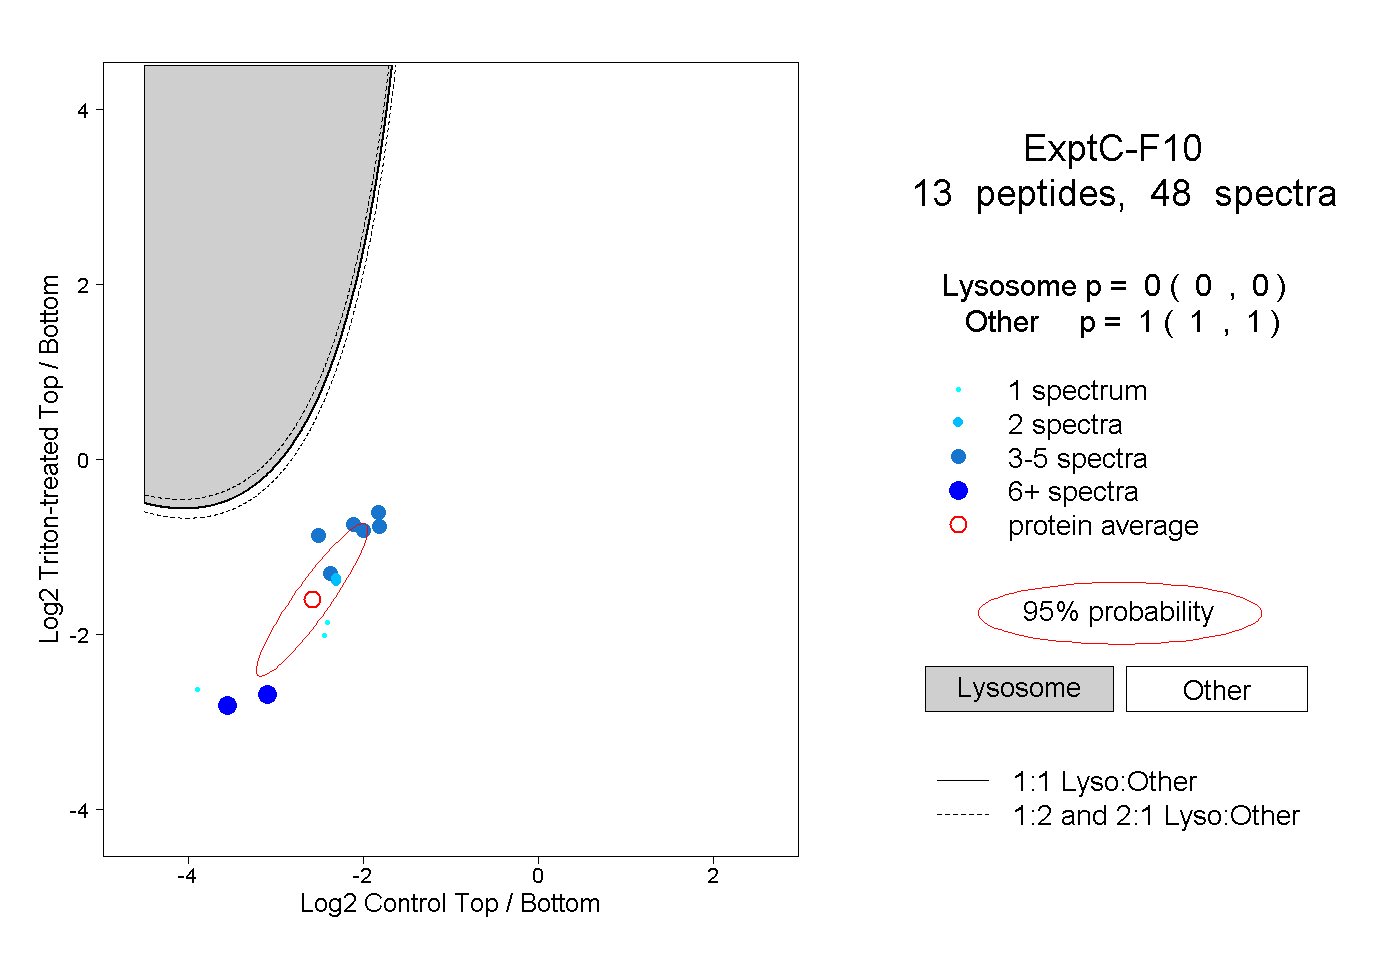
0.000 | 0.000
1.000 | 1.000
8peptides
spectra
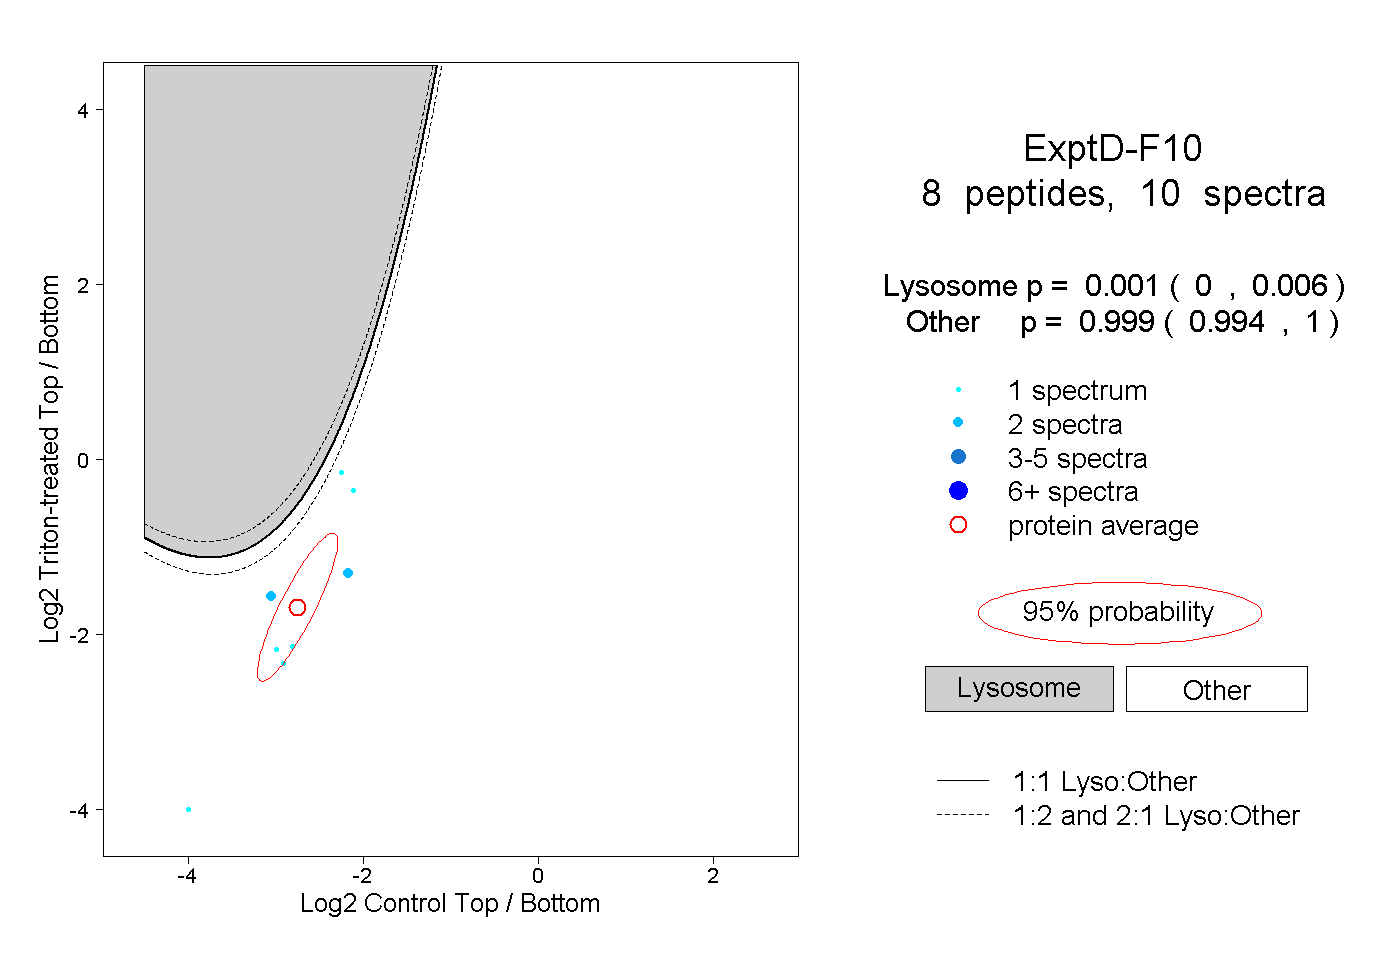
0.000 | 0.006
0.994 | 1.000