 15
15peptides
spectra
0.000 | 0.000
0.295 | 0.322
0.000 | 0.000
0.389 | 0.413
0.000 | 0.000
0.000 | 0.000
0.281 | 0.294
0.000 | 0.000
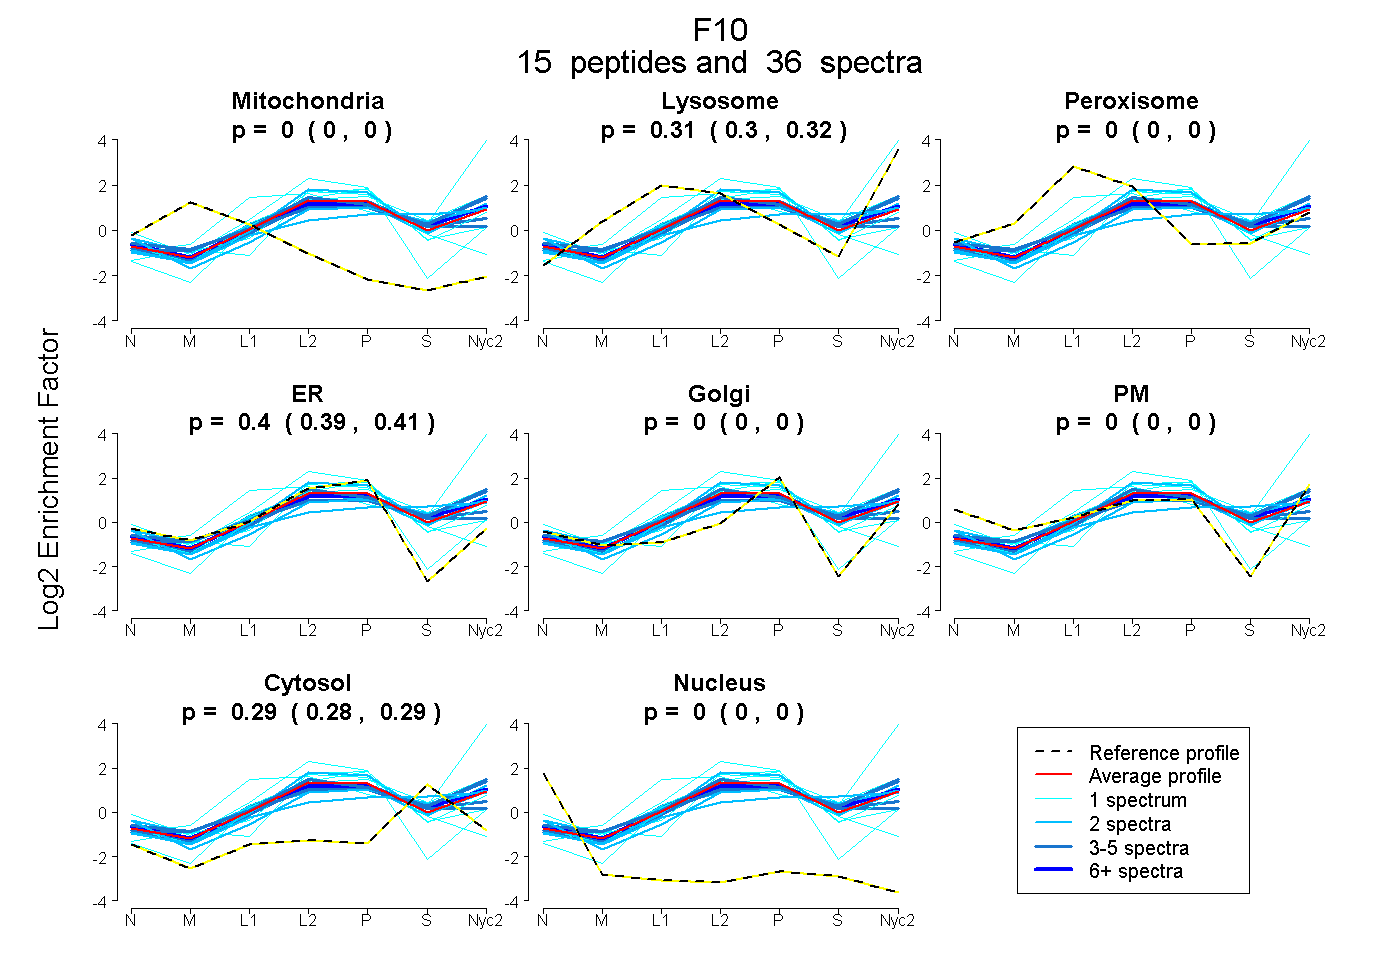
| Plot | Mito | Lyso | Perox | ER | Golgi | PM | Cytosol | Nucleus | |||||
| Expt A |
15 peptides |
36 spectra |
|
0.000 0.000 | 0.000 |
0.310 0.295 | 0.322 |
0.000 0.000 | 0.000 |
0.402 0.389 | 0.413 |
0.000 0.000 | 0.000 |
0.000 0.000 | 0.000 |
0.288 0.281 | 0.294 |
0.000 0.000 | 0.000 |
| 1 spectrum, DWAEATLMTQK | 0.000 | 0.900 | 0.000 | 0.000 | 0.000 | 0.000 | 0.100 | 0.000 | ||
| 1 spectrum, EEQNSVVCSCAK | 0.000 | 0.100 | 0.000 | 0.639 | 0.000 | 0.000 | 0.261 | 0.000 | ||
| 1 spectrum, SCLSTAPFPCGK | 0.000 | 0.252 | 0.000 | 0.541 | 0.000 | 0.000 | 0.207 | 0.000 | ||
| 2 spectra, YGIYTK | 0.000 | 0.312 | 0.000 | 0.118 | 0.091 | 0.000 | 0.479 | 0.000 | ||
| 2 spectra, GYFLGNDGK | 0.000 | 0.273 | 0.035 | 0.190 | 0.070 | 0.163 | 0.268 | 0.000 | ||
| 4 spectra, DTYDFDIAMLR | 0.000 | 0.410 | 0.000 | 0.282 | 0.000 | 0.000 | 0.308 | 0.000 | ||
| 5 spectra, QEDACQGDSGGPHVTR | 0.000 | 0.116 | 0.154 | 0.396 | 0.000 | 0.000 | 0.334 | 0.000 | ||
| 4 spectra, VTAFLK | 0.000 | 0.444 | 0.000 | 0.274 | 0.000 | 0.000 | 0.282 | 0.000 | ||
| 6 spectra, IVGGQECK | 0.000 | 0.335 | 0.000 | 0.342 | 0.000 | 0.000 | 0.324 | 0.000 | ||
| 1 spectrum, LCSLDNGDCDQFCR | 0.000 | 0.000 | 0.067 | 0.651 | 0.000 | 0.000 | 0.282 | 0.000 | ||
| 2 spectra, TEPEANSDDVIR | 0.000 | 0.290 | 0.000 | 0.469 | 0.000 | 0.000 | 0.241 | 0.000 | ||
| 3 spectra, ENVAPACLPQK | 0.000 | 0.223 | 0.000 | 0.427 | 0.000 | 0.000 | 0.350 | 0.000 | ||
| 1 spectrum, EVFEDNEK | 0.000 | 0.027 | 0.099 | 0.874 | 0.000 | 0.000 | 0.000 | 0.000 | ||
| 1 spectrum, TPITFR | 0.000 | 0.391 | 0.000 | 0.230 | 0.035 | 0.000 | 0.344 | 0.000 | ||
| 2 spectra, TGIVSGFGR | 0.000 | 0.191 | 0.000 | 0.175 | 0.073 | 0.158 | 0.403 | 0.000 |
| Plot | Mito | Lyso or Perox | ER | Golgi | PM | Cytosol | Nucleus | ||||||
| Expt B |
2 peptides |
3 spectra |
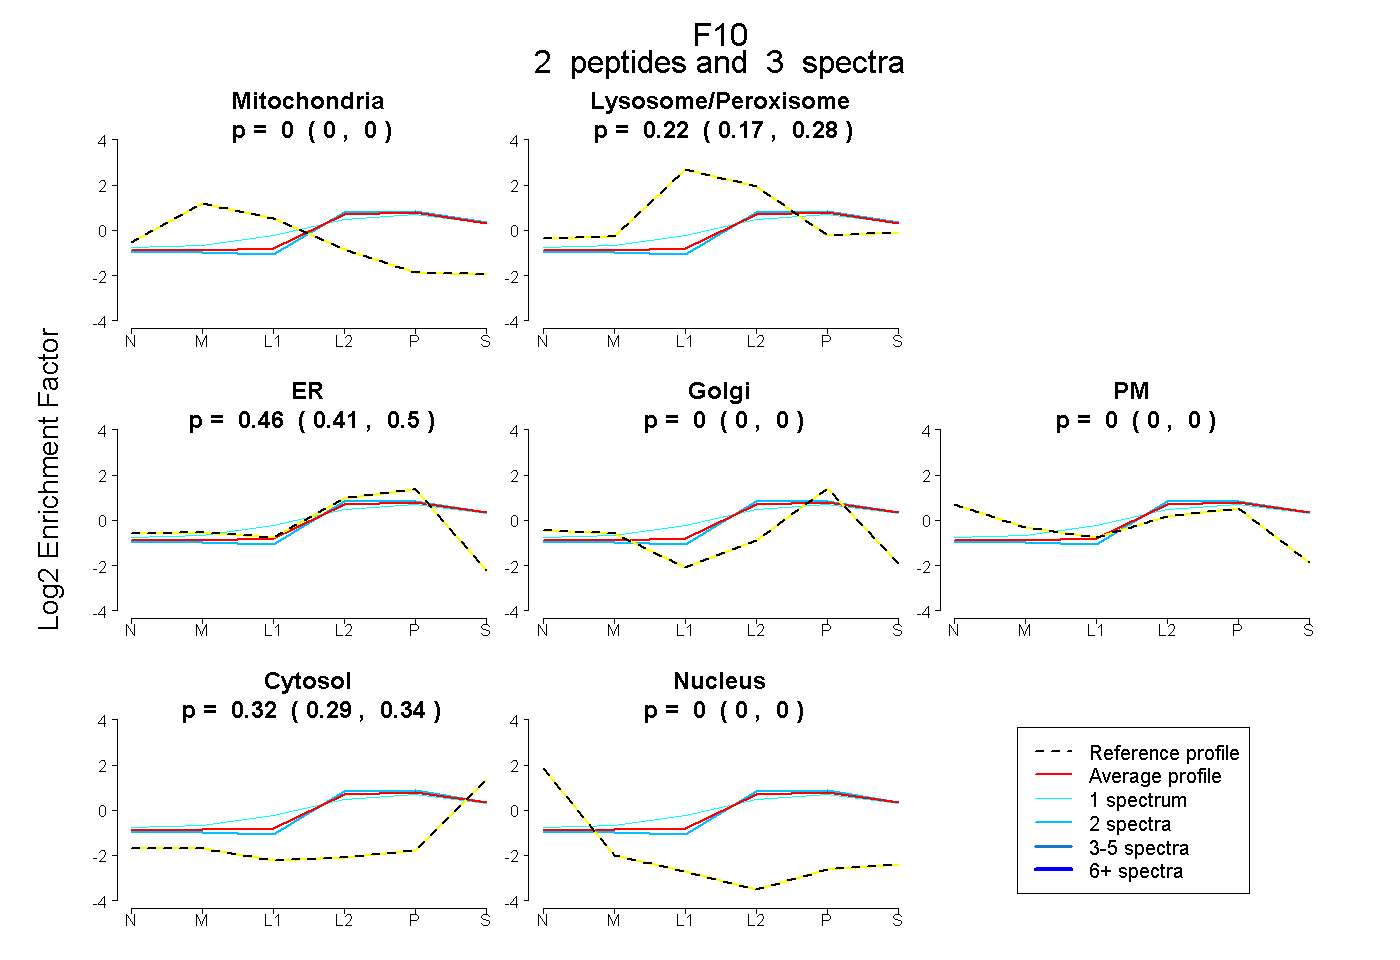 |
0.000 0.000 | 0.000 |
0.222 0.165 | 0.275 |
0.462 0.410 | 0.496 |
0.000 0.000 | 0.000 |
0.000 0.000 | 0.000 |
0.316 0.291 | 0.335 |
0.000 0.000 | 0.000 |
|||
| Plot | Lyso | Other | |||||||||||
| Expt C |
13 peptides |
48 spectra |
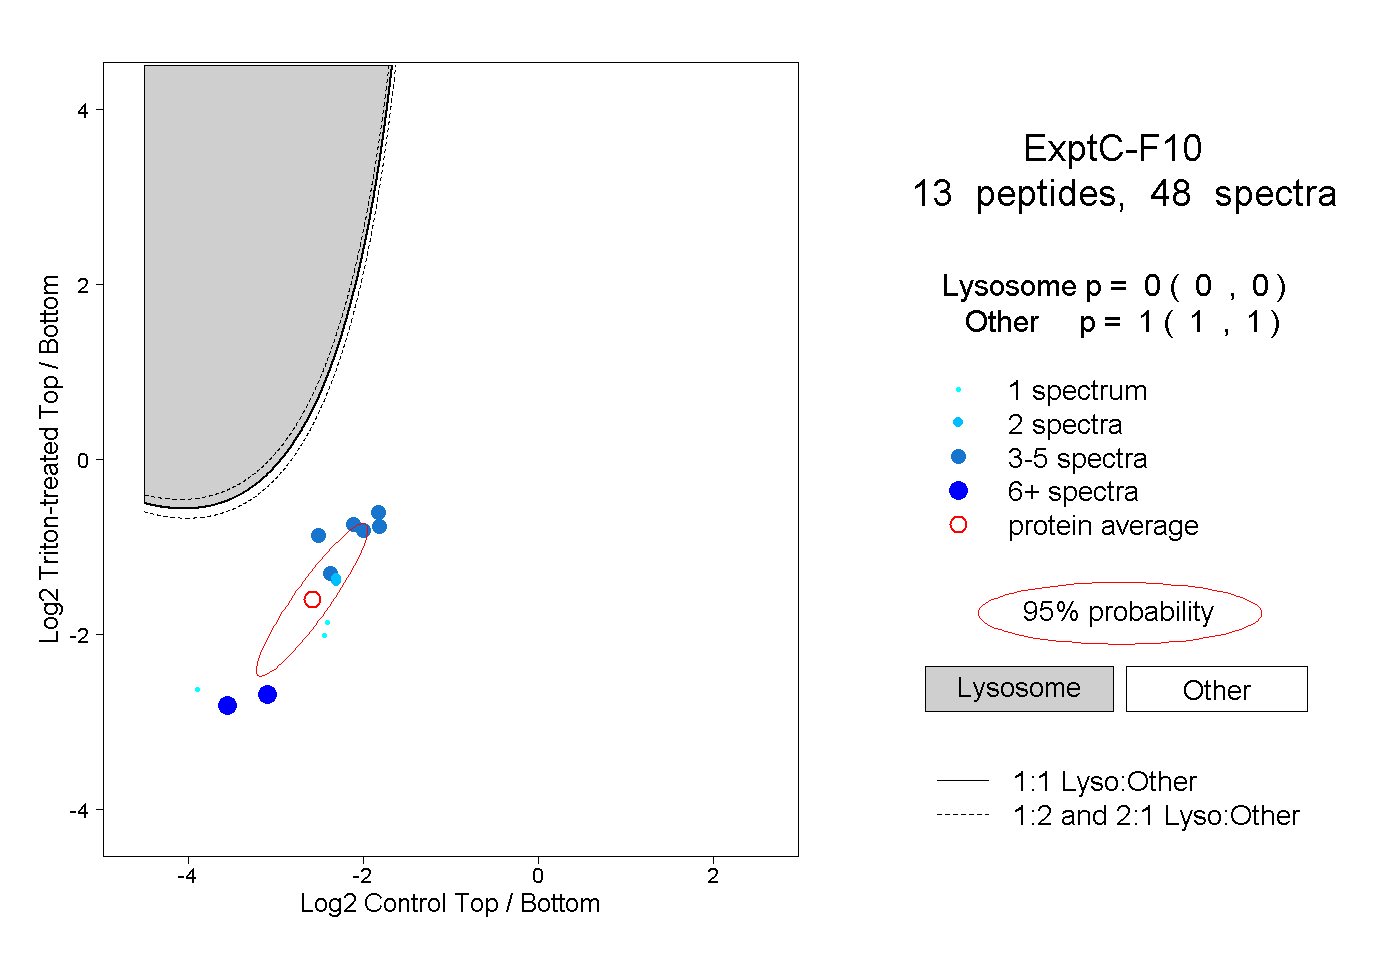 |
0.000 0.000 | 0.000 |
1.000 1.000 | 1.000 |
||||||||
| Plot | Lyso | Other | |||||||||||
| Expt D |
8 peptides |
10 spectra |
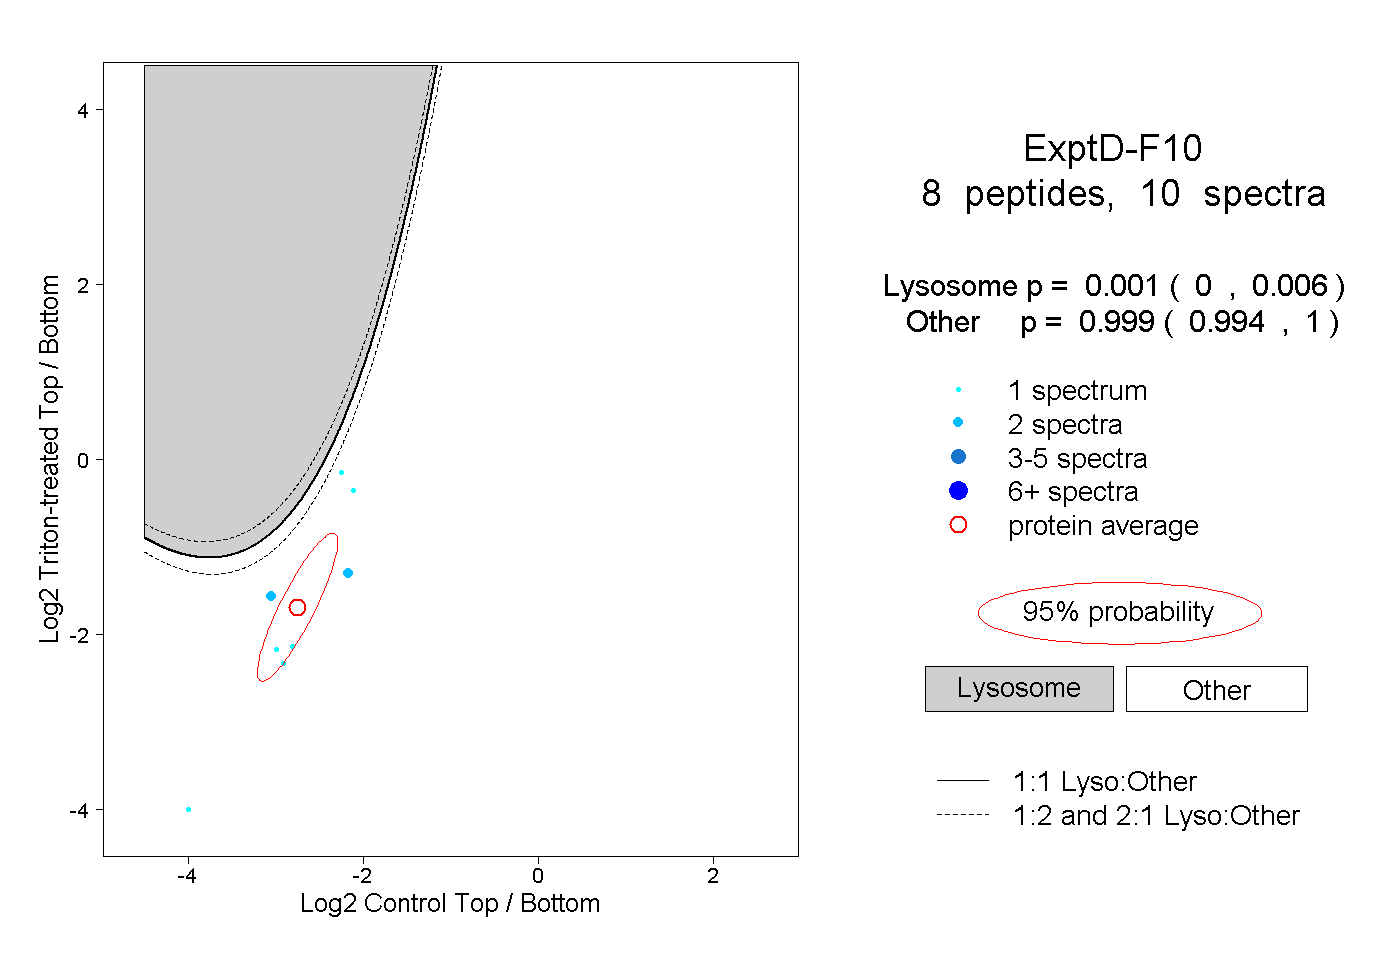 |
0.001 0.000 | 0.006 |
0.999 0.994 | 1.000 |